Fig. 5.
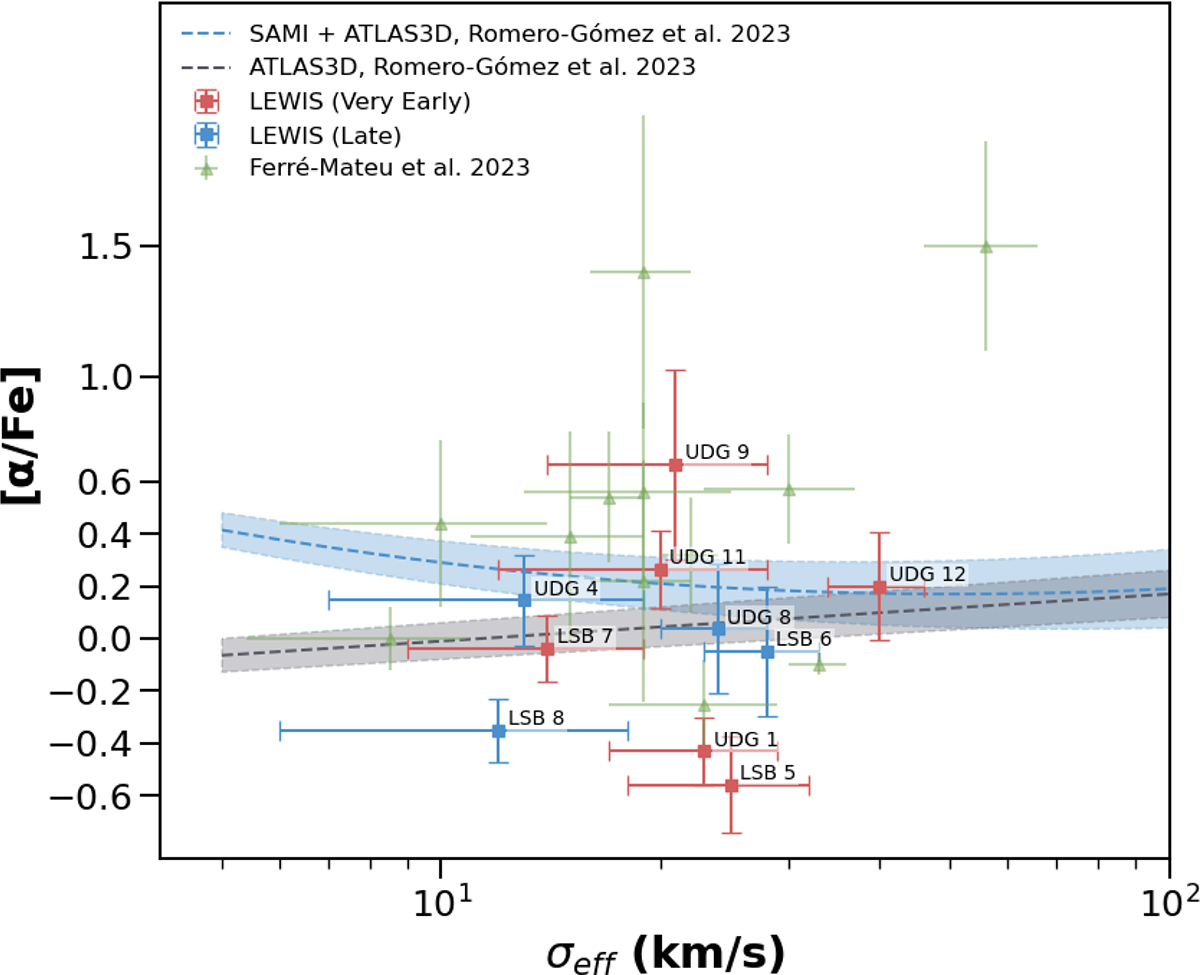
Download original image
Velocity dispersion measurements as a function of alpha abundances. LEWIS galaxies are colour-coded as in Fig. 1. Green triangles are UDGs analysed by Ferré-Mateu et al. (2023). Values of σeff for LEWIS are from Paper II. The dashed black line and the corresponding shaded region represent the average trend of massive early-type galaxies from ATLAS3D survey (Cappellari et al. 2011). The light blue line and the corresponding shaded region represent the average trend ATLAS3D survey together with the sample of dwarf galaxies in the Fornax cluster from the SAMI survey (Romero-Gómez et al. 2023).
Current usage metrics show cumulative count of Article Views (full-text article views including HTML views, PDF and ePub downloads, according to the available data) and Abstracts Views on Vision4Press platform.
Data correspond to usage on the plateform after 2015. The current usage metrics is available 48-96 hours after online publication and is updated daily on week days.
Initial download of the metrics may take a while.