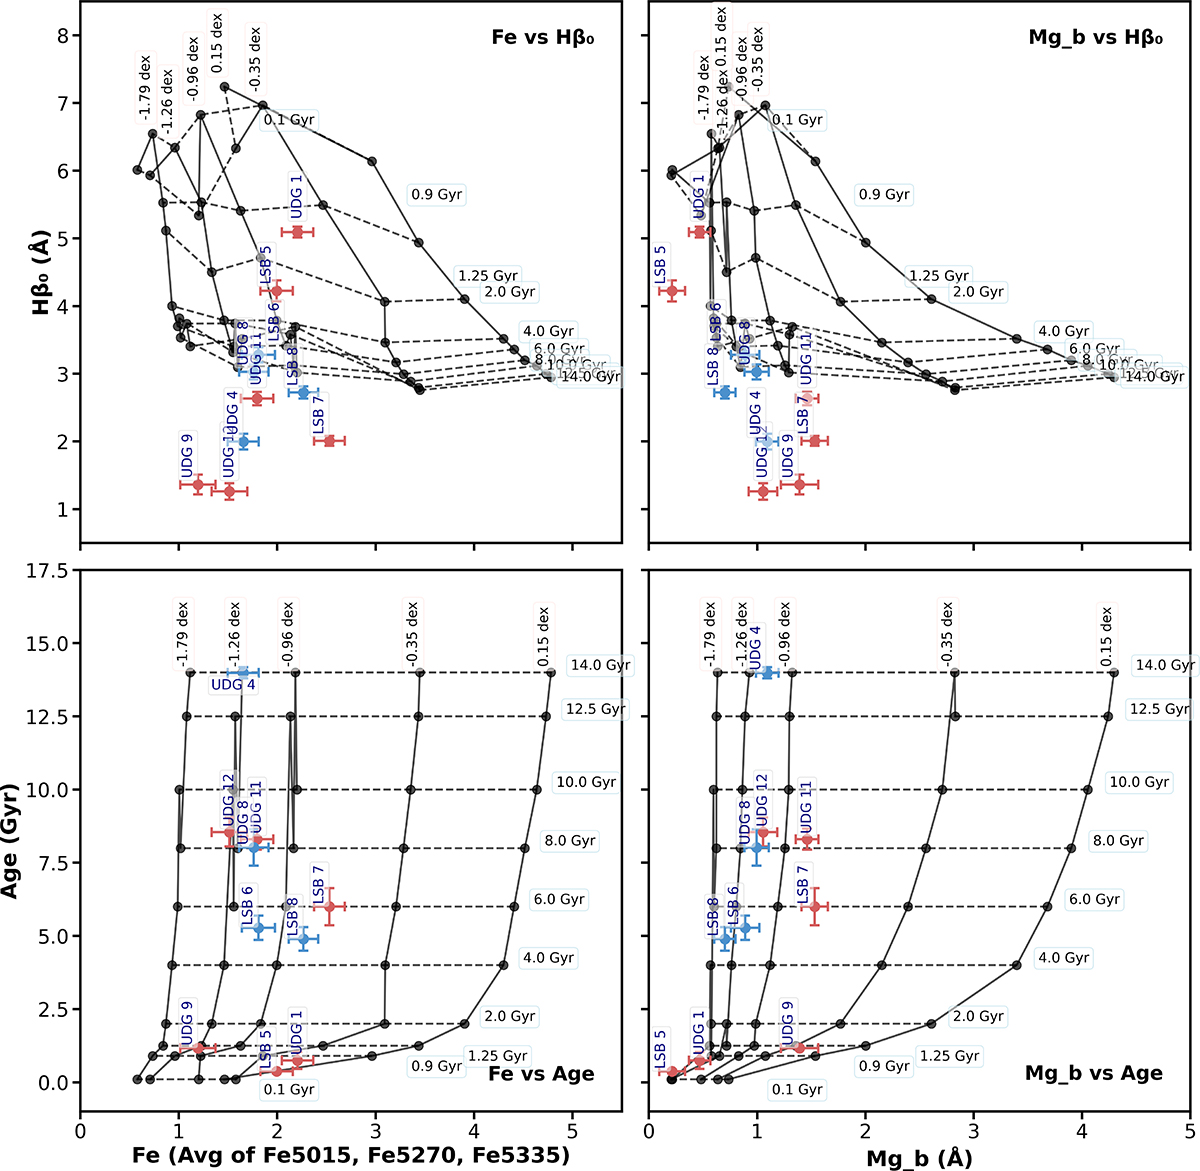
Fig. A.2.
Download original image
Top row: E-MILES base models compared to line indices data points from our sample. Bottom row: E-MILES model grids used to compute the [Mg/Fe] enhancement, using the light-weighted age of the models and ppxf to make the grids orthogonal, and this is better defined in the old and metal-poor regime. LEWIS galaxies are colour-coded as in Fig. 1
Current usage metrics show cumulative count of Article Views (full-text article views including HTML views, PDF and ePub downloads, according to the available data) and Abstracts Views on Vision4Press platform.
Data correspond to usage on the plateform after 2015. The current usage metrics is available 48-96 hours after online publication and is updated daily on week days.
Initial download of the metrics may take a while.