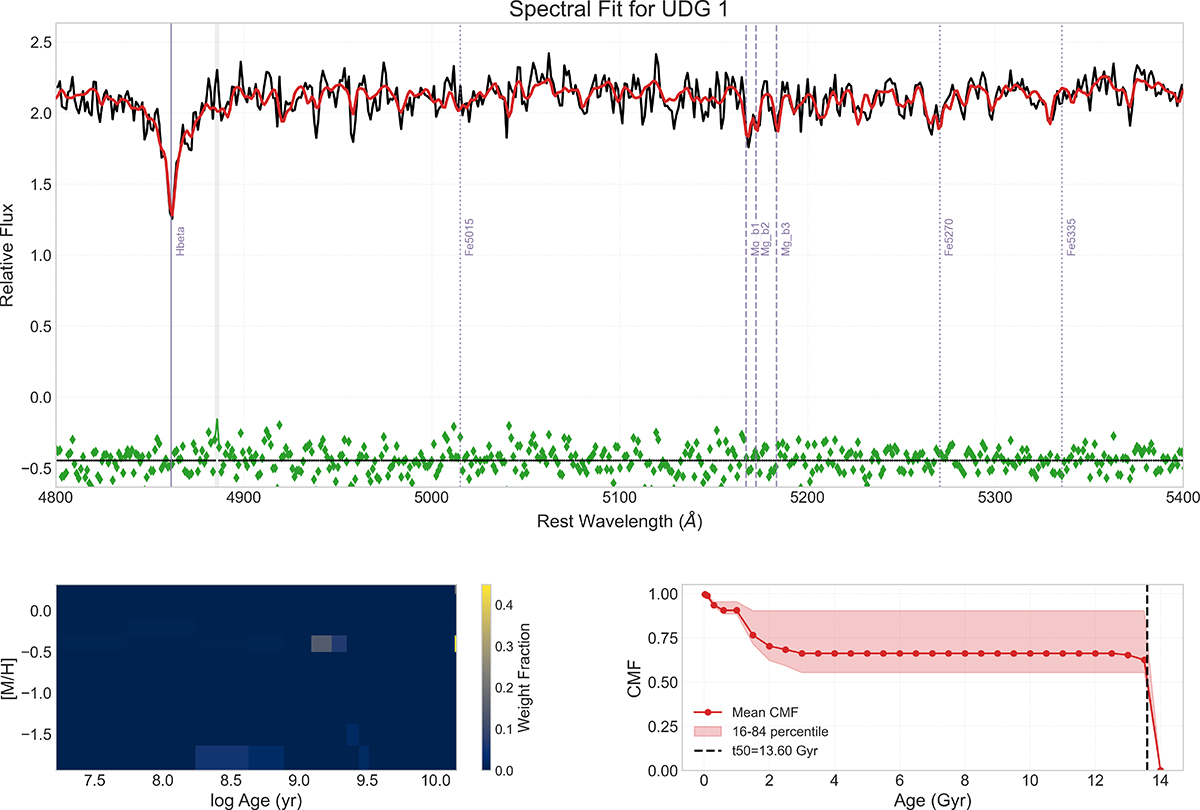
Fig. B.1.
Download original image
Stellar population properties and SFH of UDG1. Top panel: MUSE 1 Re stacked spectrum (solid black line) for UDG1. The main absorption features are marked in purple. The solid red line represents the best fit obtained with ppxf. The green points denote the residuals between the observed spectrum and its best-fit template spectrum. The grey areas indicate the masked regions excluded from the fit. Bottom left panel: Age-metallicity distribution of the MC iterations of UDG1. Bottom right panel: Cumulative mass fraction, based on the MC iterations. t50 marks the time at which 50% of the galaxy mass was formed.
Current usage metrics show cumulative count of Article Views (full-text article views including HTML views, PDF and ePub downloads, according to the available data) and Abstracts Views on Vision4Press platform.
Data correspond to usage on the plateform after 2015. The current usage metrics is available 48-96 hours after online publication and is updated daily on week days.
Initial download of the metrics may take a while.