Fig. 3
Download original image
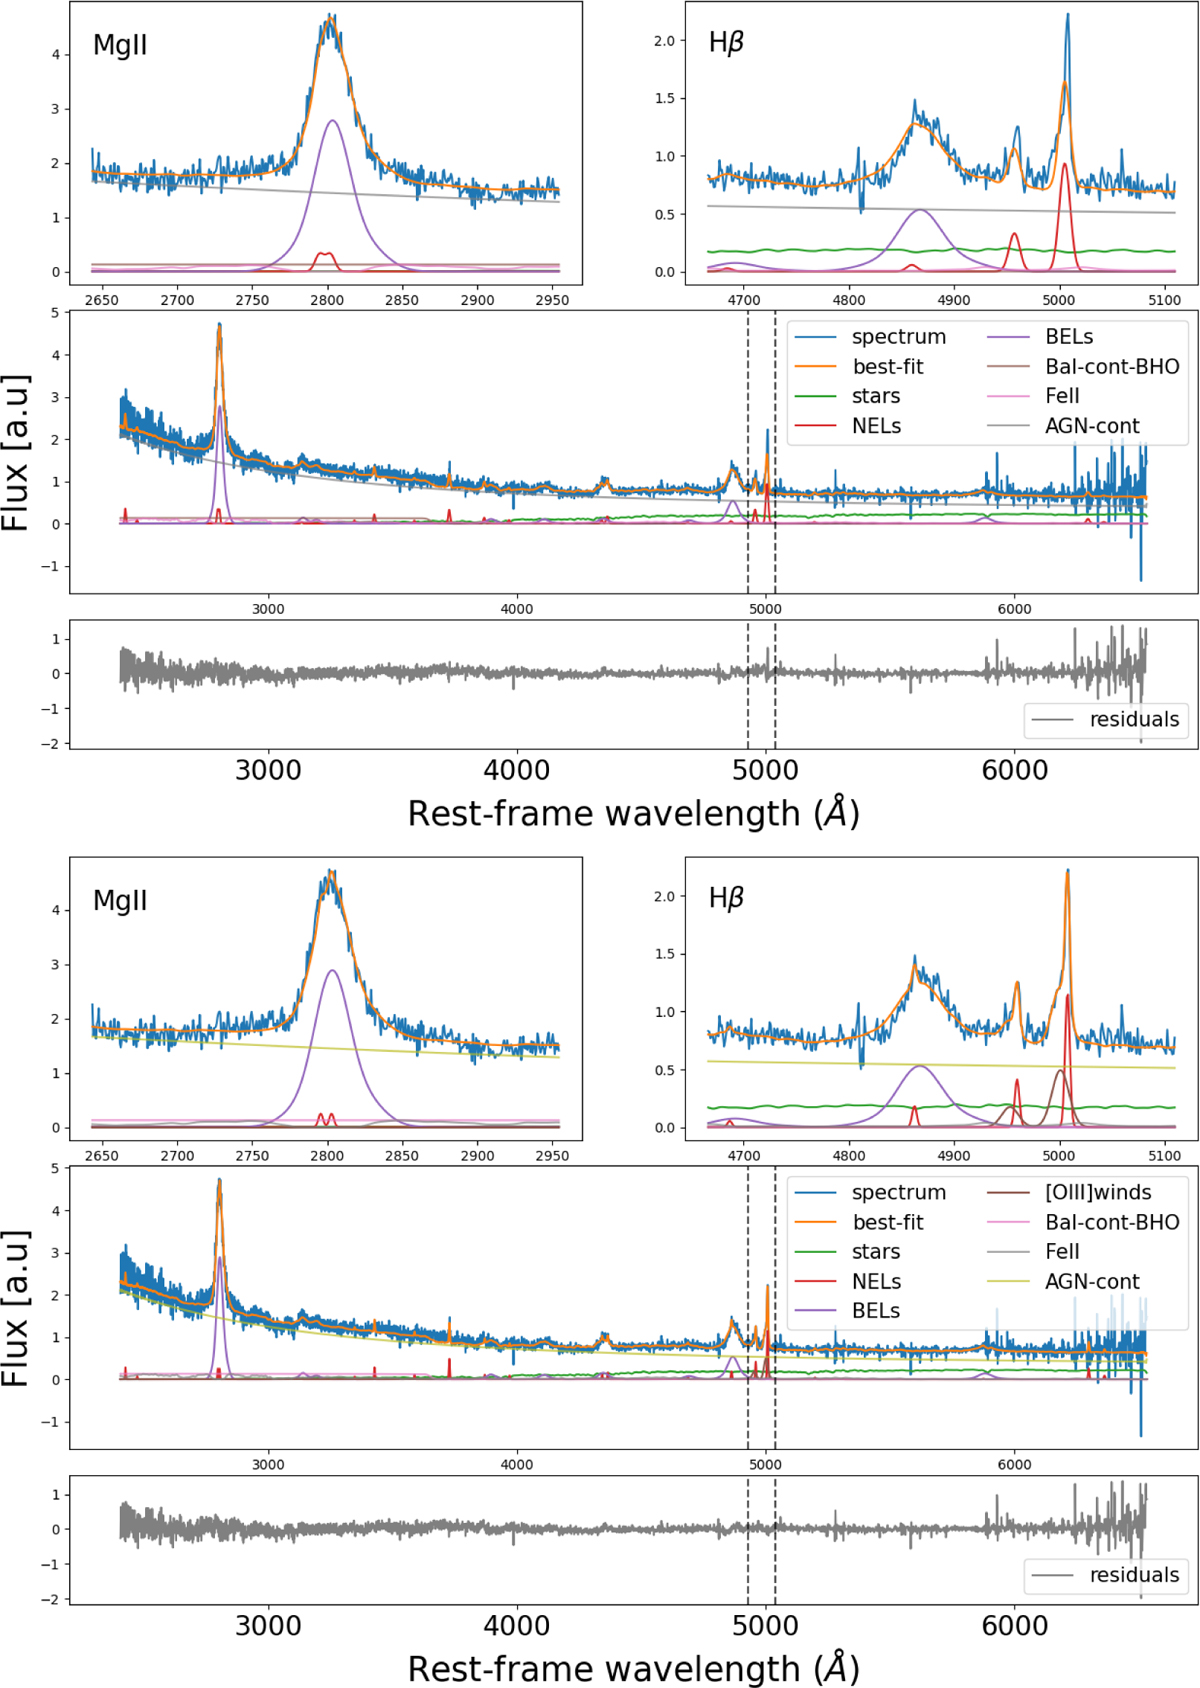
Comparison of the best-fit of a spectrum fitted with model-1 (three top panels), and model-3 (three bottom panels), the last was the final result from the code. The Hβ and MgII regions are zoomed, and the total fit and residuals are also shown. The main difference between the two fits is the use of [OIII]winds. Dashed lines delimit the region where the DWT flagged the residuals structure (see Appendix A). All panels have the same arbitrary units on y-axis.
Current usage metrics show cumulative count of Article Views (full-text article views including HTML views, PDF and ePub downloads, according to the available data) and Abstracts Views on Vision4Press platform.
Data correspond to usage on the plateform after 2015. The current usage metrics is available 48-96 hours after online publication and is updated daily on week days.
Initial download of the metrics may take a while.