Fig. 4
Download original image
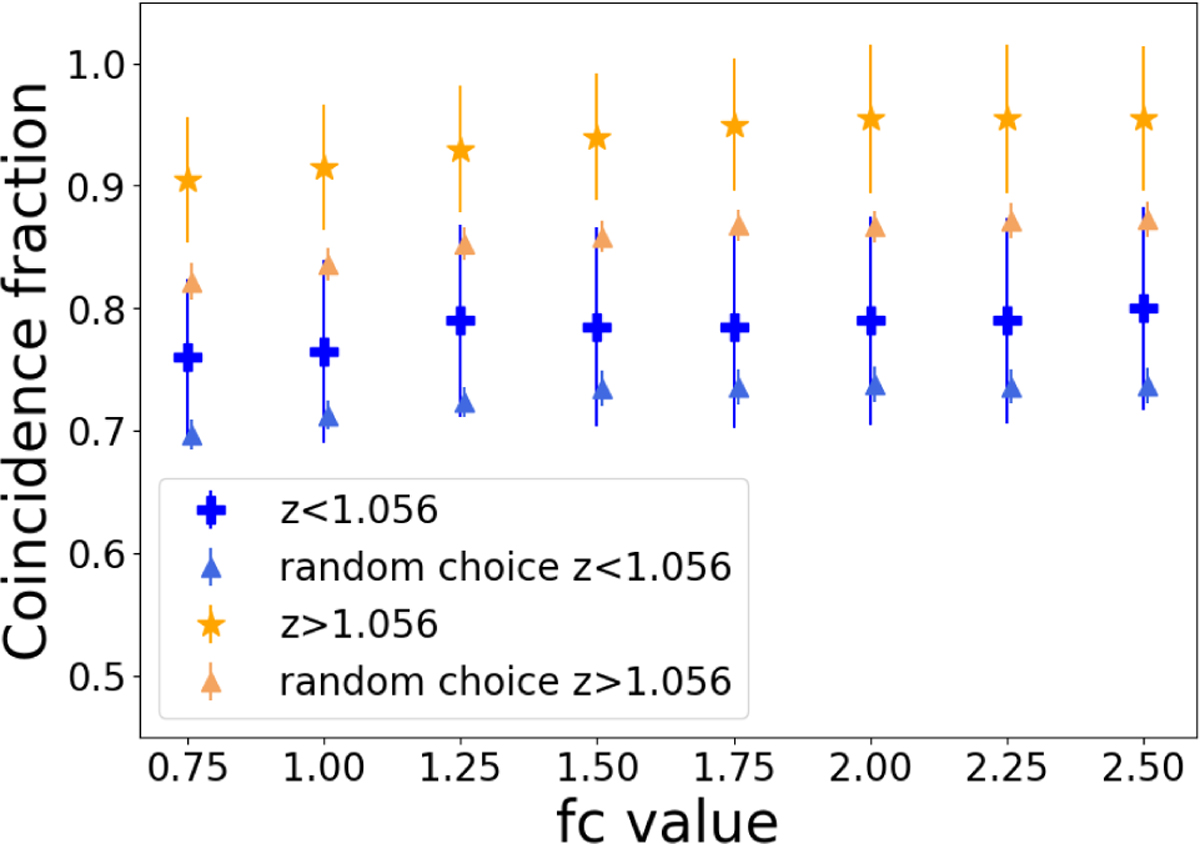
Coincidence ratio between the algorithm and each validator. The mean coincidence across all validators is shown in markers, and the root-mean-squared scatter of coincidence ratios is represented by the error bars. Blue marks are for objects with z < 1.056 and orange marks for z > 1.056. The small markers (same color code) represent the random median fraction of coincidence obtained by the re-shuffling of the model choice by each validator.
Current usage metrics show cumulative count of Article Views (full-text article views including HTML views, PDF and ePub downloads, according to the available data) and Abstracts Views on Vision4Press platform.
Data correspond to usage on the plateform after 2015. The current usage metrics is available 48-96 hours after online publication and is updated daily on week days.
Initial download of the metrics may take a while.