Fig. 11
Download original image
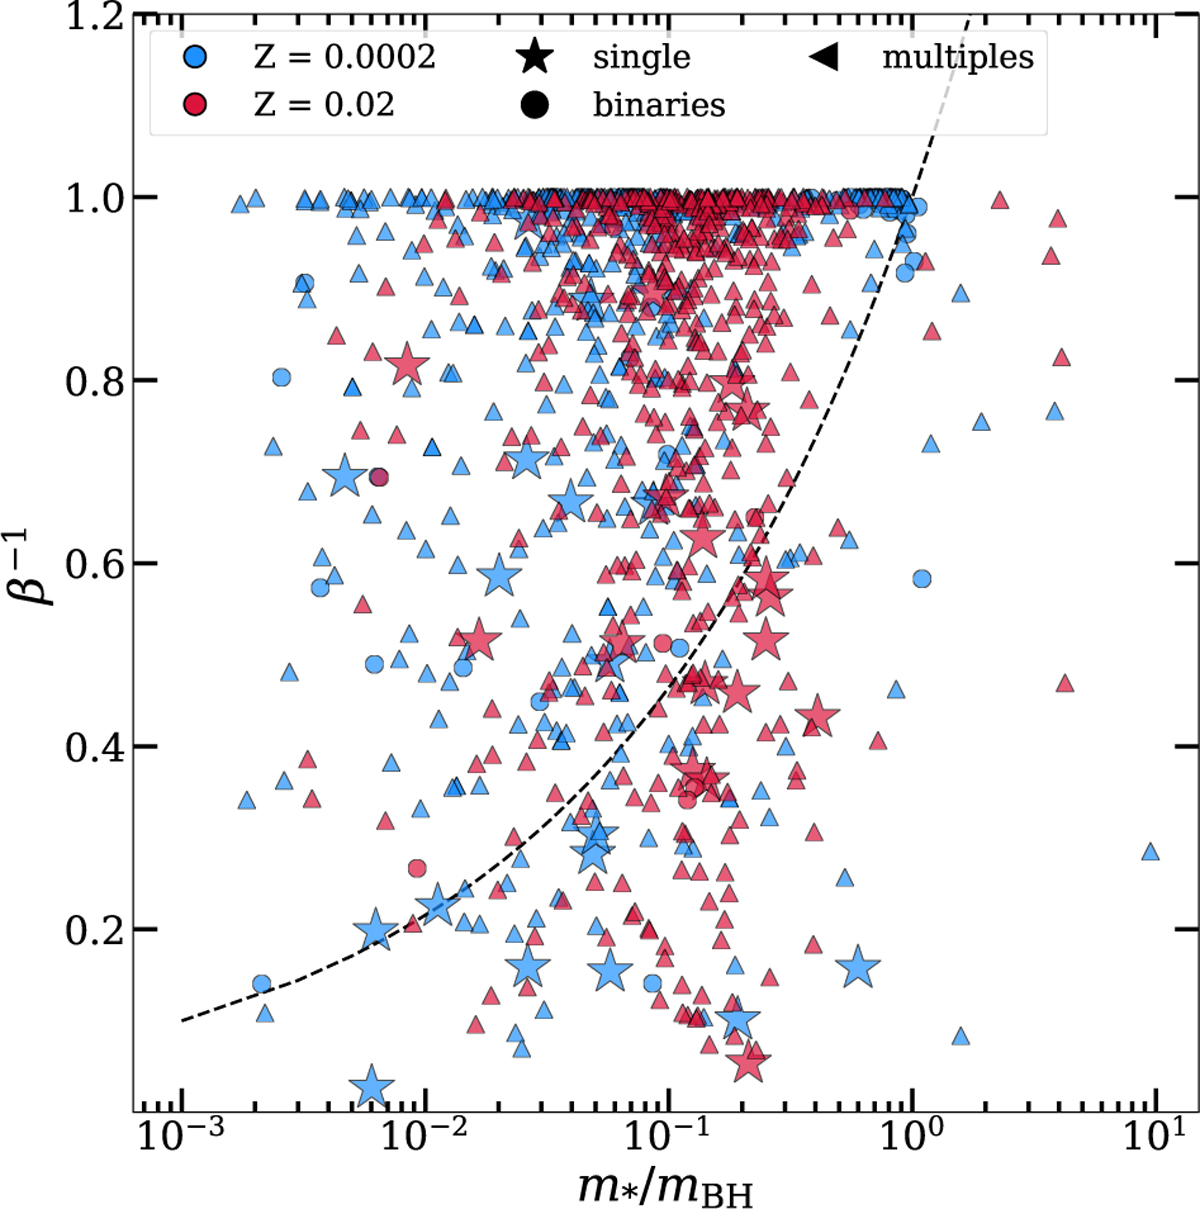
Distribution of BH micro-TDEs in the plane defined by the stellar-to-BH mass ratio (m∗/mBH) and the inverse of the penetration factor (β−1). The micro-TDEs occurring in our simulated YSCs are shown using the same axes and parameter space as Figure 1 of Kremer et al. (2022). Each channel (see Sect. 3.1) is marked with a different symbol: single (stars), binaries (circles), and multiples (triangles). Blue for Z = 0.0002 and red for Z = 0.02. The dashed black line indicates the boundary for which (rp = r∗), where r∗ is the star radius.
Current usage metrics show cumulative count of Article Views (full-text article views including HTML views, PDF and ePub downloads, according to the available data) and Abstracts Views on Vision4Press platform.
Data correspond to usage on the plateform after 2015. The current usage metrics is available 48-96 hours after online publication and is updated daily on week days.
Initial download of the metrics may take a while.