| Issue |
A&A
Volume 707, March 2026
|
|
|---|---|---|
| Article Number | A217 | |
| Number of page(s) | 19 | |
| Section | Galactic structure, stellar clusters and populations | |
| DOI | https://doi.org/10.1051/0004-6361/202556781 | |
| Published online | 17 March 2026 | |
Micro-tidal disruption events in young star clusters
1
Departament de Física Quàntica i Astrofísica (FQA), Universitat de Barcelona (UB),
c. Martí i Franquès 1,
08028
Barcelona,
Spain
2
Institut de Ciències del Cosmos (ICCUB), Universitat de Barcelona (UB),
c. Martí i Franquès 1,
08028
Barcelona,
Spain
3
ICREA,
Pg. Lluís Companys 23,
08010
Barcelona,
Spain
4
Institut d’Estudis Espacials de Catalunya (IEEC), Edifici RDIT,
Campus UPC,
08860
Castelldefels (Barcelona),
Spain
5
School of Physics and Astronomy, Sun Yat-sen University,
Daxue Road,
Zhuhai
519082,
China
6
CSST Science Center for the Guangdong-Hong Kong-Macau Greater Bay Area,
Zhuhai
519082,
China
★ Corresponding authors: This email address is being protected from spambots. You need JavaScript enabled to view it.
; This email address is being protected from spambots. You need JavaScript enabled to view it.
Received:
8
August
2025
Accepted:
31
December
2025
Abstract
Context. Dense young star clusters (YSCs) are ideal environments for dynamical interactions between stars and stellar compact objects, such as black holes and neutron stars. In such dense environments, stars can undergo close encounters with black holes and fall within their tidal radius, resulting in tidal disruption. These events, known as micro-tidal disruption events (micro-TDEs), are transient phenomena with potential multi-messenger signatures.
Aims. We aim to quantify the nature, occurrence, and observational relevance of micro-TDEs across a wide range of cluster masses, densities, and metallicities through an extensive exploration of the parameter space.
Methods. We performed a suite of direct N-body simulations using the PETAR code, to which we implemented new prescriptions for modelling micro-TDEs. We constructed a set of realistic YSC models including primordial binaries based on the observed Milky Way population. Our simulations incorporate stellar and binary evolution, supernova kicks, and stellar winds using the BSE code, and they account for the Galactic tidal field via the GALPY library.
Results. We identified three primary dynamical channels for micro-TDE production: single star–single black hole encounters, binary-mediated interactions (including supernova-kick triggers), and interactions involving higher-order multiple systems such as hierarchical triples and quadruples as well as chaotic few-body interactions with more than three objects. Multiple encounters are the most efficient production channel and thus dominate the total production rate: ∼250–450 Gpc−3 yr−1. Micro-TDEs from YSCs are expected to be detectable by upcoming surveys, particularly the Legacy Survey of Space and Time, with detection rates potentially up to hundreds per year. The gravitational wave signals expected from the micro-TDE peak in the deci-Hertz band, making them accessible to future instruments such as the Lunar Gravitational Wave Antenna and the Deci-Hertz Interferometer Gravitational wave Observatory.
Conclusions. Micro-TDEs emerge as promising multi-messenger sources, potentially offering unique insights into star cluster dynamics, stellar collisions, and the population of dormant stellar-mass black holes, through both electromagnetic and gravitational wave observations.
Key words: gravitational waves / methods: numerical / stars: black holes / stars: kinematics and dynamics / galaxies: star clusters: general
© The Authors 2026
 Open Access article, published by EDP Sciences, under the terms of the Creative Commons Attribution License (https://creativecommons.org/licenses/by/4.0), which permits unrestricted use, distribution, and reproduction in any medium, provided the original work is properly cited.
This article is published in open access under the Subscribe to Open model. This email address is being protected from spambots. You need JavaScript enabled to view it. to support open access publication.
1 Introduction
Tidal disruption events (TDEs) are transient phenomena that occur when a star is disrupted during a close pericentre passage near a supermassive black hole (SMBH; see e.g. Hills 1975). The characteristic distance from the SMBH where a TDE occurs is the ‘tidal radius’,
 (1)
and it depends on the mass and the radius of the star (m∗ and r∗, respectively) and on the black hole mass (mBH). When the pericentre of the encounter, rp, falls within the tidal radius,
(1)
and it depends on the mass and the radius of the star (m∗ and r∗, respectively) and on the black hole mass (mBH). When the pericentre of the encounter, rp, falls within the tidal radius,
 (2)
the SMBH’s tidal forces exceed the star’s self-gravity, leading to its partial or total disruption. Following disruption, approximately half of the stellar debris becomes unbound, while the remaining bound material returns to the pericentre on highly eccentric orbits and eventually forms an accretion disc around the SMBH (Rees 1988; Guillochon & Ramirez-Ruiz 2013; Komossa 2015). The accretion of the star’s debris can power a luminous flare detectable across multiple electromagnetic (EM) wavelengths (X-ray, optical, UV), thanks to which hundreds of TDEs have been identified so far (Gezari 2021; Hammerstein et al. 2023). In addition to their EM signatures, TDEs are also expected to produce bursts of gravitational waves (GWs) when the star is torn apart (see e.g. Kobayashi et al. 2004; Toscani et al. 2020; Pfister et al. 2022; Wevers & Ryu 2023).
(2)
the SMBH’s tidal forces exceed the star’s self-gravity, leading to its partial or total disruption. Following disruption, approximately half of the stellar debris becomes unbound, while the remaining bound material returns to the pericentre on highly eccentric orbits and eventually forms an accretion disc around the SMBH (Rees 1988; Guillochon & Ramirez-Ruiz 2013; Komossa 2015). The accretion of the star’s debris can power a luminous flare detectable across multiple electromagnetic (EM) wavelengths (X-ray, optical, UV), thanks to which hundreds of TDEs have been identified so far (Gezari 2021; Hammerstein et al. 2023). In addition to their EM signatures, TDEs are also expected to produce bursts of gravitational waves (GWs) when the star is torn apart (see e.g. Kobayashi et al. 2004; Toscani et al. 2020; Pfister et al. 2022; Wevers & Ryu 2023).
Tidal disruption events are not exclusive to SMBHs, as stars can also be tidally disrupted by stellar-mass compact objects (COs), such as stellar black holes (BHs) and neutron stars (NSs). These events, referred to as ‘micro-TDEs’1, a term first introduced by Perets et al. (2016), represent a scaled-down analogue of classical TDEs involving SMBHs. Micro-TDEs are expected to occur primarily in dense stellar environments, such as young star clusters (YSCs), globular clusters (GCs), and nuclear star clusters (NSCs), where dynamical close encounters between stars and COs are common. In these dense and massive star clusters (SCs), COs can be efficiently retained, facilitating interactions with stars (Giesers et al. 2018; Kremer et al. 2019; Gieles et al. 2021; Rastello et al. 2020, 2021; Torniamenti et al. 2022, 2023; Arca Sedda et al. 2024).
Previous analytical estimates (Perets et al. 2016) predicted that micro-TDEs occur in GCs at rates of approximately 3–10 Gpc−3 yr−1 in the local Universe. Kremer et al. (2019, 2021) estimated even higher rates for GCs and YSCs (10–100 Gpc−3 yr−1). Additionally, micro-TDEs are also expected to occur in NSCs at rates up to ∼10 Gpc−3 yr−1 (Fragione et al. 2021) and in the disc of active galactic nuclei (AGNs) at an even higher rate ≈170 Gpc−3 yr−1 (Fragione et al. 2021; Yang et al. 2022; Li et al. 2026).
A key difference between micro-TDEs and classical TDEs is that the former may also involve few-body systems and/or multiple COs, such as stellar binaries or binary compact objects (BCOs), including binary black holes (BBHs). Ryu et al. (2022, 2023a,b, 2024) extensively studied close encounters between main sequence (MS) stars and BHs in multiple three-body configurations, using both smoothed particle hydrodynamics (SPH) and moving-mesh codes. Lopez et al. (2019) showed through hydrodynamic simulations that micro-TDEs on BBHs in a SCs can alter the intrinsic spins of the two BHs. Kıroğlu et al. (2023) showed that BBH and star collisions can lead to spin-orbit alignment. Samsing et al. (2019) demonstrated that BH-star disruptions by BBHs can be used to constrain the orbital period of the binary and to link such events to the corresponding merger rates. Fragione et al. (2019) showed that secular dynamics in hierarchical triple systems can also produce BH-star TDEs at non-negligible rates (∼10−4 yr−1). Kremer et al. (2019, 2021) showed that in GCs and YSCs, micro-TDEs occur several times more frequently in binary mediated encounters compared to single-single encounters. Rastello et al. (2019), through direct N-body simulations, found that micro-TDEs in BBHs occur in open clusters (OCs) at a rate of ∼3–30 Gpc−3 yr−1.
Micro-TDEs are also relevant in the context of low-mass X-ray binaries (LMXBs) and the recently discovered population of dormant BHs (Giesers et al. 2018; Shenar et al. 2022a; El-Badry et al. 2023b,a; Gaia Collaboration 2024). Unlike LMXBs, where accretion from the companion star powers detectable X-ray emission (Avakyan et al. 2023), these dormant BHs are X-ray silent and are identified through precise astrometric and spectroscopic measurements of the motion of their luminous companions. Although most of these systems have been discovered in the field (El-Badry et al. 2023b,a; Shenar et al. 2022b), a dynamical origin in stellar clusters has not been excluded (Rastello et al. 2023; Tanikawa et al. 2023; Di Carlo et al. 2024). Notably, the most massive BH currently known in the Milky Way (MW), Gaia BH3 (mBH ≈ 33 M⊙, Gaia Collaboration 2024), has recently been shown to be associated with the stellar stream of the disrupted GC ED2 (Balbinot et al. 2024), suggesting a dynamical origin (Marín Pina et al. 2024, 2025). If such long-period BH-star binaries are dynamically perturbed, for example, through binary-single or binary-binary encounters in SCs, their orbits may shrink or become highly eccentric, potentially driving the companion star close enough to the BH to trigger a micro-TDE. In this framework, dormant BHs could represent progenitors of future micro-TDEs in dense stellar environments.
Perets et al. (2016) proposed that micro-TDEs could explain highly energetic phenomena such as ultra long gamma-ray bursts (Beniamini et al. 2025). Kremer et al. (2021) proposed stellar-mass BH TDEs as a possible progenitor of fast blue optical luminous transients, which are often observed in star forming galaxies. Kremer et al. (2023) performed (SPH) simulations of BH-MS stars, showing that radiation reprocessed by disc winds can produce bright UV/optical transients (peak luminosities ∼1041−44 erg s−1) that can be detected by ongoing and upcoming surveys as the Zwicky Transient Facility (ZTF) at the Palomar Observatory (Bellm et al. 2019; Graham et al. 2019), the Legacy Survey of Space and Time (LSST) at the Vera C. Rubin Observatory (Ivezić et al. 2019), and Ultraviolet Transient Astronomy Satellite (ULTRASAT) (Sagiv et al. 2014; Ben-Ami et al. 2022; Shvartzvald et al. 2024).
Although micro-TDEs have yet to be directly observed, there are currently three potential candidates, though none have been definitively confirmed. Two of these candidates, ASASSN-15lh (Dong et al. 2016) and ZTF19aailpwl (Frederick et al. 2021), are associated with an AGN disc (Yang et al. 2022). The third candidate, AT 2022aedm (Nicholl et al. 2023), is associated with an elliptical galaxy. However, these candidates are too luminous compared to models of micro-TDE light curves, and further analysis is needed to confirm their nature.
In addition to EM surveys, a significant boost in GW detection is expected in the coming years thanks to instruments such as the Lunar Gravitational Wave Antenna (LGWA; Harms et al. 2021), the Laser Interferometer Space Antenna (LISA; Amaro-Seoane et al. 2017), and the Deci-Hertz Interferometer Gravitational wave Observatory (DECIGO; Sato et al. 2017).
Micro-TDEs could serve as an alternative and complementary source for multi-messenger observations, offering valuable insights into the properties of COs in SCs (Naoz et al. 2025). These observations would complement data from GW interferometers and surveys, such as those identifying dormant BHs (Gaia Collaboration 2024), which are expected to boost with the next Gaia data release (Breivik et al. 2017). This is especially significant given the realisation within the scientific community that the large degeneracy in stellar and binary evolutionary models, combined with uncertainties in star formation models, has hindered our ability to obtain stringent constraints from GW observations alone. Therefore, accurate modelling of micro-TDEs is both crucial and timely.
In this work, we present a comprehensive study of micro-TDEs involving stars, BHs, and NSs in YSCs. We model these environments using state-of-the-art high-precision gravitational N-body simulations that integrate updated stellar evolution and tidal disruption prescriptions. Our approach captures the full range of dynamical interactions capable of producing stellar disruptions, accounting for all relevant configurations in which stars are destroyed during close encounters with COs. By exploring the demographics and parameter space of micro-TDEs in realistic SC environments, our results offer valuable predictions for their occurrence rates and observable properties, thus filling a critical gap in our understanding of stellar dynamics and CO interactions in these dense environments.
In Sect. 2.1, we present the numerical code used to perform the suite of simulations, while in Sect. 2.2 we describe the initial conditions. In Sect. 3 we show the results, including the formation channels of micro-TDEs, the production efficiency, and the estimated rates. Sect. 4 is focused on the discussion, including a comparison with previous works, expected detectability, and implications for GW astronomy. Caveats are discussed in Sect. 4.6. In Sect. 5, we summarise our main findings and present our conclusions. In Appendix A, we describe the modifications implemented in the code to include the TDE prescription.
Appendices B.1 and B.2 provides two additional tables reporting the production efficiency, detectability, and additional statistics on the micro-TDEs.
2 Numerical methods
2.1 Star cluster models
We construct a grid of SC models to explore a wide range of initial conditions, varying the total initial cluster mass (MSC), the half-mass radius (rh) and corresponding half-mass density  , based on the observed population of Galactic YSCs presented in Krumholz et al. (2019). A schematic representation of the parameter space explored is shown in Fig. 1.
We sample the cluster mass in the range 103 M⊙ ≤ MSC ≤ 105 M⊙ using two overlapping logarithmically spaced grids. The first grid includes seven mass values in the range 103 M⊙ ≤ MSC ≤ 5 × 10⁴ M⊙, while the second contains seven points in the range 5 × 10³ M⊙ ≤ MSC ≤ 105 M⊙. For each cluster mass, we explore multiple values of rh, sampled on a logarithmic grid as well, thereby covering three orders of magnitude in ρh. To mitigate the impact of stochastic fluctuations in low-mass clusters, where the lower number of stars leads to greater variance, we fix the total simulated mass Msim per mass bin. This strategy ensures uniform statistical sampling across the entire mass range and provides improved coverage of the region of parameter space occupied by observed Galactic YSCs in Krumholz et al. (2019) (see Fig. 1).
First, we generated a population of N single stars and binaries and the total number of stars is (1 + fbin)N, where fbin is the binary fraction. Stellar masses are sampled from a Kroupa (2001) initial mass function (IMF) in the range 0.08–150 M⊙. Masses of primary stars in binaries are drawn from the IMF as single stars, while secondary components are paired based on the mass ratio distribution. Stellar and binary properties are assigned according to the empirical prescriptions of Moe & Di Stefano (2017), which provide mass-dependent distributions for the binary fraction, mass ratio, period, and eccentricity (see Fig. 2). Second, we compute the total stellar mass MSC by summing the masses of all stars, including both components of binaries. Because the initial multiplicity is entirely set by the Moe & Di Stefano (2017) distributions together with our adopted IMF, all clusters start with the same global binary fraction (≃35%, with only minor stochastic variations).
Third, we sampled N phase space coordinates for the single stars and for the center-of-mass of the binaries for each cluster using a custom Python pipeline based on the limepy library (Gieles & Zocchi 2015), which samples positions and velocities from equilibrium dynamical models with a specified central potential. We adopt a King model (King 1966) with dimensionless central potential W0 = 7 and total mass MSC.
For binaries, we additionally computed the relative positions and velocities of the two components based on their sampled orbital parameters. The orbital phase is specified by drawing the mean anomaly uniformly from [0, 2π], the inclination by sampling cos i uniformly in [−1, 1], and the longitude of the ascending node uniformly in [0, 2π].
We considered two different metallicities: Z = 0.0002 (metal poor) and Z = 0.02 (metal rich), where Z indicates the mass fraction of metals (all elements heavier than helium). In total we ran 3600 N-body simulations. Since each SC hosts a population of binaries built up during cluster initialisation, we distinguish two classes of binaries: (i) ‘primordial binaries’, whose components have been bound since the cluster’s formation (see Fig. 2), and (ii) ‘exchanged binaries’, where the components become bound through dynamical encounters during the cluster’s evolution.
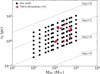 |
Fig. 1 Grid of SC models created in this work, adapted from Fig. 9 in Krumholz et al. (2019). Black dots refer to combinations of initial half-mass radius, rh; cluster mass, MSC; and initial density (at the half-mass radius), ρh (M⊙ pc−3), used to construct the SC simulations. Red triangles indicate to the observed YSCs (Krumholz et al. 2019). |
2.2 N-body simulations
To follow the dynamical evolution and the interactions between stars and COs in the generated SCs, we perform a suite of N-body simulations with the state-of-the-art code PETAR (Wang et al. 2020a). PETAR combines a fourth-order Hermite integrator for short-range interactions with the Particle-tree method for long-range interactions (Oshino et al. 2011) to efficiently handle both close encounters and large-scale dynamics. PETAR is designed to work across multiple nodes on supercomputer clusters taking advantage of a hybrid parallelisation: MPI, OpenMP CUDA, SIMD instructions (AVX, AVX2, AVX-512), and GPU acceleration are exploited to reduce the computational effort through FDPS platform (Iwasawa et al. 2016, 2020). An accurate regularisation algorithm (SDAR, Wang et al. 2020b) is implemented in the code to handle close encounters, binaries, and hierarchical systems.
However, the current version of PETAR does not include any prescriptions for micro-TDEs. To address this limitation, we have developed a customised version of the code that incorporates their treatment. In our implementation, PETAR triggers a micro-TDE whenever a star passes within rt of a CO (see Eq. (2)). When this occurs, we assume that the star is fully disrupted and PETAR removes it from the simulation, in analogy with the treatment of CO-star collisions and/or mergers adopted in PETAR and other direct N-body codes (e.g. Rastello et al. 2019; Rantala et al. 2024). Following the results of hydrodynamical simulations (e.g. Perets et al. 2016; Li et al. 2026) and accretion-flow models (e.g. Kremer et al. 2023), we further assume that the CO accretes 10% of the mass of the disrupted star. PETAR does not include tidal dissipation or tidal capture for parabolic or hyperbolic encounters. Therefore, in a star-CO interaction on an unbound orbit, the outcome is restricted to either a tidal disruption event (or a direct collision) or a pure flyby that leaves the object masses unchanged and does not result in the formation of a bound system. Appendix A provides a detailed description of the micro-TDE implementation adopted.
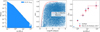 |
Fig. 2 Properties of primordial binaries adopted in our simulations, shown for one representative cluster realisation with initial mass mSC ≈ 9.8 × 10⁴ M⊙ and initial half-mass radius rh ≈ 4 pc. Left panel: mass distribution of primary stars (m1) in binaries and single stars (msing). Both populations are sampled from a Kroupa IMF. Central panel: distribution of binary orbital eccentricities (ecc) as a function of period (log(P) in days). The red curve marks the exclusion boundary (Eq. (3) in Moe & Di Stefano 2017), to avoid Roche lobe filling binaries. Right panel: mass-dependent binary fraction ( fbin) in our realisation (blue points) compared to observational constraints from Moe & Di Stefano (2017). |
2.2.1 Stellar evolution and binary processes
In its default version, PETAR accounts for stellar evolution and binary processes through a coupling with the population synthesis code BSE (Hurley et al. 2000, 2002) in the updated version described in Banerjee et al. (2020, Sect. 2). In particular, the updates incorporate new semi-empirical stellar wind prescriptions for massive stars following Belczynski et al. (2010), supernova (SN) and remnant formation models by Fryer et al. (2012), pair-instability and pulsation pair-instability SN models as in Belczynski et al. (2016).
In our simulation, we use the delayed SN model by Fryer et al. (2012) in which the explosion is driven by neutrinos on a time scale of hundreds of milliseconds after the formation of the proto-NSs. These models imply a continuous distribution of remnant masses, with no mass gap between NSs and BHs consistent with the recent detection of massive NSs or low-mass BHs in the mass range 2.5–5 M⊙ (see e.g. Wyrzykowski & Mandel 2020; Abbott et al. 2020; Ray et al. 2025). In our models the minimum mass allowed for BH is thus 3 M⊙.
2.2.2 External tidal field and initialization
In order to evolve the SCs within a realistic Galactic tidal field, we include a MW-like external potential based on the model MWPotential2014 in GALPY introduced in Bovy (2015). The dynamical model includes a inner spheroidal bulge-like component with total mass Mbulge = 5 × 10⁹ M⊙, a Myamoto-Nagai stellar disc (Miyamoto & Nagai 1975) with mass Mdisc = 6.8 × 10¹⁰ M⊙, and a Navarro-Frank-White dark matter halo (Navarro et al. 1997) with virial mass Mhalo = 8 × 10¹² M⊙.
Each cluster is initially placed on a circular orbit (220 km s−1) at the Solar radius (R = 8 kpc). The clusters are then evolved for ≈1.5 Gyr, ensuring that all the SCs experience at least one relaxation time during the N-body integration.
3 Results
3.1 Micro-TDE classification
In this section, we classify the evolutionary pathways leading to micro-TDEs. We identify three main channels involving compact objects and stars that satisfy the TDE condition (Eq. (2)).
‘Singles’: The single CO and the single star are not previously bound and approach each other on a hyperbolic/parabolic orbit that brings the star at a pericentre distance which is within the CO’s rt2.
‘Binaries’: this channel includes cases in which a star and a CO are bound together and Eq. (2) is satisfied because of (i) binary hardening following distant dynamical interactions; or (ii) the expansion of the star in the binary (e.g. stellar radius expansion etc.); or (iii) the CO progenitor undergoes an SN explosion (Perets et al. 2016; Michaely et al. 2016; Hirai & Mandel 2022; Tsuna & Lu 2025). If the newly formed CO receives a sufficiently strong natal kick, the binary orbit may be altered in such a way that the pericentre of the surviving star falls within rt, leading to a micro-TDE. These events are grouped under the name “SN-kick” sub-channel.
‘Multiples’: this channel involves micro-TDE induced during multiple dynamical interactions (Perets et al. 2016) as (i) ‘hierarchical’ triples (or quadruples), where an inner binary is perturbed by one (or more) outer component(s), and (ii) ‘democratic or resonant’ few-body encounters, in which the star is disrupted during a non-secular N-body interaction involving three or more components.
CO-star binaries that undergo a micro-TDE can either form dynamically during the cluster evolution or originate as bound systems at birth. Accordingly, when discussing the binaries and multiples channels, we further distinguish whether the CO-star pair system involved in the micro-TDE is an ‘exchanged’ or a ‘primordial’ binary. In the following sections we describe the TDE channels, the efficiency and the rate for the case of BH– star interactions, while NS interactions are treated separately in Sect. 3.7.
3.2 The ‘singles’ channel
Considering both metallicities and all formation channels, only about ≈3% of micro-TDEs originate from BH-star single encounters. In Figure 3, we show the distribution of BH and star masses and penetration factor, defined as β = rt/rp, of single encounters for metal-poor (top panel) and metal-rich (bottom panel) YSCs.
At Z = 0.0002, the BH masses (mBH) range from ≈17 to ≈52 M⊙, while the stellar companion masses span ≈0.2 to 21 M⊙. At solar metallicity, because of strong stellar winds (Vink et al. 2001), the BH masses involved are typically lower, ranging in this sample from ≈13 to ≈31 M⊙ while the disrupted stars have masses between ≈0.25 and ≈6 M⊙.
A notable difference between the two metallicities appears in the distribution of penetration factors. In metal-rich YSCs, the encounters typically have rt/rp ≈ 1–3, indicating that the interactions are generally less deeply penetrating compared to metal-poor environments (rt/rp up to ≈10). All interactions are in the gravitational focusing regime, such that the pericentre of a hyperbolic or parabolic encounter is inversely proportional to the total mass of the interacting objects (for fixed impact parameter and velocity at infinity). Because the mass distribution of the disrupted stars is not strongly dependent on metallicity, the range of penetration factor is primarily determined by the mass of the BHs. As shown in the bottom panel of Fig. 3, at Z⊙, most events occur with BH masses clustered around ∼15 M⊙, while at Z = 0.0002, the range of BH masses is broader and including more massive BHs, leading to a wider spread in penetration factor, ranging from ∼1 to ∼10.
Most stars involved in single encounters are MS stars with few exceptions (5% giants) at both metallicities. Roughly 40% single encounters take place within the core radius of the parent SCs, where high density favours this kind of interactions.
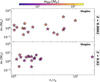 |
Fig. 3 Distribution of penetration factor (rt/rp) and star masses (m∗ in M⊙) of BH micro-TDEs occurring during single encounters for Z = 0.0002 (top panel) and Z = 0.02 (bottom panel). The colour map shows the BH masses (mBH in M⊙). |
3.3 The ‘binaries’ channel
Micro-TDEs originating from the ‘binaries’ channel are rare, accounting for ≈7% of the total sample, and occur predominantly (≈80%) in metal-poor environments (see also Sect. 3.5). At Z = 0.0002, these events involve BH masses ranging from ≈3 to ≈45 M⊙ and stellar masses from ≈0.1 to ≈43 M⊙. The disrupted stars are mainly giant stars (≈55%), followed by MS and naked helium stars,3 each contributing ≈35% and ≈15% respectively.)
In metal-rich environments (Z = 0.02), BHs involved in this channel are typically lighter, with masses between ≈4 and ≈35 M⊙, and stellar masses between ≈0.2 and ≈27 M⊙. Here, the disrupted stars are exclusively MS stars.
Among both metallicities, approximately 70% of the events occur with a penetration factor close to 1. These are cases in which the TDE condition (Eq. (2)) is triggered by the expansion of the companion star’s radius. Overall, ≈70% of the micro-TDEs in the binary channel arise from the evolution of ‘primordial’ binaries (see Table B.1), driven primarily by stellar processes such as common envelope (CE) evolution and mass transfer (MT), rather than dynamical interactions.
This evolutionary origin is also reflected in the eccentricity distribution: for the binary channel, the distribution peaks around e ≈ 0.1, with ≈44% of systems falling in this range, consistent with the circularisation effects expected from (CE) and (MT) phases.
A subset of micro-TDEs in the binary channel is triggered by the SN explosion of the BH progenitor (Perets et al. 2016; Tsuna & Lu 2025). These events are rare, accounting for ≈0.7% of the total micro-TDEs at Z = 0.0002 and ≈0.4% at Z⊙. However, within the binary channel at Solar metallicity, nearly half of the events are associated with SN natal kicks (see Fig. 4, green crosses).
In metal-rich environments, the larger stellar radii lead to early stellar mergers that prevent the formation of BH-star systems in close orbits (see e.g. Iorio et al. 2023). The surviving BH-star binaries reside in wide systems where a fortunate post-SN kick configuration can place the stars on an eccentric orbit, thereby triggering the micro-TDE.
3.4 The ‘multiples’ channel
Most (≈90%) micro-TDEs occur during multiple encounters within the evolution of YSCs (Fig. 5 ): 86% in metal-poor and 94% in metal-rich clusters. Notably, 91% of these multiple interactions involve ‘exchanged’ BH-star binaries, highlighting the importance of dynamics in shaping these events.
At Z = 0.0002, the stellar masses range from ≈0.08 M⊙ to ≈135 M⊙, and BH masses range from 3 M⊙ up to ≈192 M⊙. Nearly all events (> 99%) occur on nearly parabolic orbits (e ≈ 0.99), with the majority involving MS stars (85%), followed by giants (8%), naked helium stars (6.3%), and white dwars (WDs; 0.7%).
Similarly, at Z = 0.02, micro-TDEs predominantly involve MS stars (98%), followed by a small fraction of giants (0.8%) and WDs (1.2%). The stellar mass ranges from a minimum of ≈0.09 M⊙ to a maximum of ≈18 M⊙, while the BH masses ranges from ≈3 M⊙ to ≈115 M⊙.
As shown by comparing Figs. 4 and 5, the latter spans a wider range of β, indicating that as a consequence of multiple dynamical interactions, stars and BHs in YSCs can approach each other more closely, resulting in highly penetrating encounters within the BH tidal radius.
Within the multiples, we categorise hierarchical triples and quadruples as flagged by the PETAR code. We classify their configurations based on the nature of the outer object (first term) and the components of the inner binary (enclosed in square brackets).
At Z = 0.0002, the most common triple configurations leading to stellar disruption are those involving COs in the inner binary. The dominant channel is BH–[BH–Star], accounting for 60% of the events, followed by Star–[BH–Star] (30%). Less frequent are BH–[Star–Star] (4%) and the rare case of Star–[BH–BH] (1%).
At Z = 0.02, most disrupted stars are found in triples of the form Star–[BH–Star] (50%), followed by BH–[Star–BH] (44%) and BH–[Star–Star] (6%).
In the case of quadruples, a direct classification into inner and outer components is less straightforward. We therefore characterised them by counting the number of BHs present in the systems. At Z = 0.0002 (Z = 0.02), the majority of disrupted systems contain one BH (56.00%, 82%), followed by systems with two BHs (23%, 17%). Systems hosting three BHs are more frequent at low metallicity (21%) but are rare at solar metallicity (1.2%). We note that we do not find any triple or quadruple hosting both BHs and NSs simultaneously.
3.5 Micro-TDE production efficiency
We assumed that the number of micro-TDEs in a stellar cluster with mass MSC follows a Poisson distribution with mean λPoisson = ηMSC, where η is the micro-TDE production efficiency. Consequently, if Nmicro−TDE,tot are produced across clusters with a combined stellar mass MSC,tot, the posterior distribution for η follows a Gamma distribution:
 (3)
(3)
We assumed a prior P(η) ∼ Gamma(α, γ) ∝ ηα−1e−γη (Gelman et al. 2014), where α is the shape parameter controlling the form of the distribution (e.g. whether it is exponentially decreasing or peaked), and γ is the scale parameter, with a larger γ shifting the distribution towards higher values and increasing its width. In the limit of a large Nmicro−TDE,tot, the posterior distribution converges to a Gaussian with a mean Nmicro−TDE,tot/MSC,tot and standard deviation of  . However, for small sample sizes, Eq. (3) provides a more robust and statistically rigorous estimate of η and its associated uncertainty.
We used Eq. (3) to estimate the global value of η from our simulations, and to explore its variation as a function of cluster mass, density, metallicity, and micro-TDE formation channel. For the prior, we adopt α = 1 and γ = 0.1 M⊙, corresponding to a nearly flat, uninformative distribution over the range  .
.
Considering the full simulation dataset, the total production efficiency is  . Figure 6 shows an increasing trend of η as a function of the cluster density. The most extreme values are observed in low-density clusters
  and high-density clusters
  . The dependence on cluster mass is less pronounced, with the highest efficiency
  observed in low-intermediate-mass clusters, while the efficiency decreases to
  in the most massive clusters. The fact that η peaks at intermediate masses is the result of the scaling of the interaction rate with MSC, ρh and two-body relaxation: in the gravitational focussing regime, the interaction rate per unit mass is proportional to ρh/σrms, where σrms is the velocity dispersion. In virial equilibrium
  such that in the absence of dynamical evolution η is expected to scale with cluster properties as
  , that is, the lowest η for the most mass clusters (at a given ρh). Two-body relaxation leads to an expansion of low-mass clusters, such that ρh ∝ M2 (e.g., Gieles et al. 2011), such that after some relaxation we have at low masses:
  . Hence, the lowest mass clusters expand as the result of relaxation leading to a reduction of η, while the most massive clusters have a low η because of their high velocity dispersion.
Figure 7 shows that η is independent of metallicity across all the micro-TDE channels analysed, except for the binary channel, which drops from  at low metallicity to
  at high metallicity (see also Fig. 4). In fact, metal-rich stars have larger stellar radii (see e.g. Costa et al. 2025), implying a higher likelihood of premature stellar mergers before the formation of the first compact remnant, thus preventing the formation of BH-star systems, hence lowering the rate of micro-TDE binaries in metal rich environment. Micro-TDEs induced by SN kicks account for the lowest contribution, with
  . The production efficiency of single encounters is subdominant
  in both environments.
The dominant contribution to the micro-TDE population at both metallicities comes from dynamically formed systems, particularly those involving higher-order multiples, with a production efficiency of  . Among the three formation channels, the multiple channel account for 87% of all micro-TDEs at Z = 0.0002 and 95% at Z = 0.02 (Fig. 5). The large number of dynamical interactions occurring in dense YSCs favours the formation of few-body systems (triples or quadruples) and promotes interactions with primordial binaries, thereby enhancing encounters between stars and BHs and thus micro-TDEs in multiples.
Additionally, the initial fraction of primordial binaries (Sect. 2.1) is another crucial ingredient because stellar binaries are known to increase the rates of dynamical collisions and TDEs (e.g., Fregeau & Rasio 2007). primordial binaries segregate towards the central region of SCs where high density enhance the interactions, collisions and three-body/multi-body encounters which boost the formation of ‘exchanged’ binaries and the reshuffling of the primordial binary components, creating new multiple systems and/or hardening the primordial binaries enough to satisfy the TDE condition (Eq. (2)).
The low dependence on metallicity and high dependence on cluster density highlight that the overall micro-TDE production is highly sensitive to the cluster’s dynamical environment, with higher-order multiple and few-body interactions playing a central role in driving stellar disruptions.
Cluster density, which has the strongest impact on production efficiency, is also one of the most poorly constrained initial parameters for YSCs (Krumholz et al. 2019). In our simulations, we explore a wide range of densities spanning three orders of magnitude, and we use the production efficiencies obtained at the lowest (ρh = 1 M⊙/pc3) and highest (ρh = 104 M⊙/pc3) density values to bracket the systematic uncertainties. In these two extreme cases, the results reflect the efficiency of micro-TDE production under the assumptions that all clusters are either born with a diffuse structure, making them more susceptible to disruption, or are significantly more concentrated and thus more resilient to disruption and characterised by enhanced dynamical activity. A summary of η posteriors for BH-star micro-TDEs different production channels and for different cluster subset can be found in Table B.1 in the appendix.
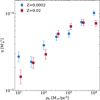 |
Fig. 6 Micro-TDE production efficiencies of BHs, η, as a function of initial cluster density, ρh, for Z = 0.0002 (blue) and Z = 0.02 (red). The seven points correspond to cluster densities sampled from the cluster initial conditions (see Figure 1). The red points have been slightly shifted in ρh to improve visual clarity. Each point and its error bar represent the median and the 68% credible interval from the posterior distribution defined in Equation (3). |
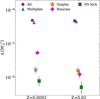 |
Fig. 7 Micro-TDE production efficiency of BHs for the two simulated metallicities. Circles indicate the efficiency considering the entire sample of events, while the other symbols represent contributions from different channels: diamonds are for single interactions, stars are for binaries, triangles are for multiples, and crosses are for micro-TDEs triggered by SN kicks (see Sect. 3.1). Each point and its error bar represent the median and the 68% credible interval from the posterior distribution defined in Eq. (3). |
3.6 Micro-TDE event rates
Using the estimated η (Sect. 3.5), we derived the co-moving event rate density, R(z), which quantifies the number of micro-TDE per unit co-moving volume and per unit time as a function of redshift. Considering the modest variation of the production efficiency with metallicity and cluster mass Figure 7 and Table B.1), we simplified the estimate of co-moving rates by neglecting the metallicity and cluster mass dependence. In addition, we assumed a null delay time, i.e. we assume that all the micro-TDE events are triggered at the moment of the cluster formation. This assumption is justified by the fact that in all simulated clusters, 50% of the TDEs are produced within 300 Myr, and 80% within 800 Myr (see also Sect. 4.7), so we expect only a moderate variation in the redshift evolution of the rate with respect to the assumed star formation rate density (SFRD), ρSFRD(z). With these approximations, the rate density as a function of redshift is
 (4)
where, fSF,SC is the fraction of total star formation occurring in YSCs. We treated η as a stochastic variable, following the distribution given in Equation (3). For fSF,SC a commonly adopted value in the literature is 0.8 (see, e.g., Lada & Lada 2003; Kremer et al. 2021), but this parameter remains poorly constrained. We therefore modelled it as an additional stochastic variable, assuming a Beta distribution with parameters αB = 4.17 and βB = 1.60 (Gelman et al. 2014). This distribution peaks at fSF,SC = 0.8, has a standard deviation of 0.15, and vanishes as fSF,SC → 1. For the SFRD, we adopted the redshift-dependent model from Madau & Fragos (2017):
(4)
where, fSF,SC is the fraction of total star formation occurring in YSCs. We treated η as a stochastic variable, following the distribution given in Equation (3). For fSF,SC a commonly adopted value in the literature is 0.8 (see, e.g., Lada & Lada 2003; Kremer et al. 2021), but this parameter remains poorly constrained. We therefore modelled it as an additional stochastic variable, assuming a Beta distribution with parameters αB = 4.17 and βB = 1.60 (Gelman et al. 2014). This distribution peaks at fSF,SC = 0.8, has a standard deviation of 0.15, and vanishes as fSF,SC → 1. For the SFRD, we adopted the redshift-dependent model from Madau & Fragos (2017):
 (5)
(5)
At each redshift, we sampled the posterior distribution of the event rate density by drawing 104 values for both η and fSF,SC. Figure 8 shows the resulting micro-TDE event rate density as a function of redshift, for the total population as well as for the different production channels (Sect. 3.1). Following the trend of the cosmic star formation rate density, R(z) increases by a factor of approximately 5 from z = 0 to z = 1, and by a factor of approximately 10 from z = 0 to z = 2.
By integrating the event rate density over the co-moving volume, Vc, we obtained the cumulative event rate up to redshift z:
 (6)
(6)
To evaluate the posterior distribution of Γ(z), we estimated the event rate density by drawing 104 samples for both η and fSF,SC (Eq. (4)). As our fiducial model, we adopted the distribution derived from the full sample of simulated YSCs. Systematic uncertainties were bracketed by considering the extreme values obtained from low-density (10 M⊙ pc−3) and high-density (104 M⊙ pc−3) cluster populations (see Sect. 3.5 and Table B.1). The integral over co-moving volume in Equation (6) was evaluated numerically, assuming the Planck18 cosmology (Planck Collaboration 2020)4.
Figure 9 shows the expected cumulative number of micro-TDE events per year for the fiducial model based on the full cluster sample as well as for the two limiting cases corresponding to low- and high-density clusters. The number of expected events per year increases from just a few within the local Universe (z < 0.05, approximately 200 Mpc) to up to 105 at z = 1. The dominant sources of uncertainty are the poorly constrained initial density distribution of stellar clusters (see Sect. 3.5) and the assumed fraction of star formation occurring in YSCs. Within the explored range of cluster densities (10–104 M⊙ pc−3; see Sect. 2.1) and adopting the sampled distribution for fSF,SC, the 3σ uncertainty spans approximately 1.7 dex, corresponding to a maximum-to-minimum ratio of ∼50.
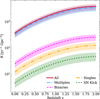 |
Fig. 8 Micro-TDE volumetric rates of BHs as a function of redshift (Eq. (4)). Solid lines show the median rates, while shaded bands indicate the 68% credible intervals obtained by sampling the posterior distributions of the production efficiency (Eq. (3)) and the fraction of star formation occurring in clusters (see Sect. 3.6). The red solid line corresponds to the total rate, while coloured lines represent the contributions from different formation channels: singles (orange, dash-dot-dot), binaries (magenta, dashed), multiples (blue, dash-dot), and SN-kicks (green, dotted), as detailed in Sect. 3.1. |
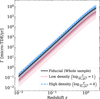 |
Fig. 9 Cumulative micro-TDE rate of BHs as a function of the redshift (Eq. (6)). The colours indicate the fiducial (black), pessimistic (low density, red), and optimistic (high density, blue) model for the micro-TDE production efficiency (see Table B.1). The lines indicate the median, while the bands show the 68% (dark) and 99.7% (light) credible interval at a given redshift z. |
3.7 Micro-TDEs on NSs
A fraction (≈20%) of micro-TDE events that occur in the simulated YSCs are triggered by NSs rather than BHs (Fig. 10). The production efficiency of micro-TDEs involving NSs is  , approximately one fourth of the efficiency found for BHs. At both Z, the largest fraction of events occur in binaries (≈70%) and the rest in (≈30%) multiples. Approximately 95% events occur in primordial binaries, while ‘exchanged’ represent only a small fraction of the sample.
No micro-TDE involving NSs is found in the single channel. This naturally arises from the lower mass of NSs and their smaller gravitational focussing, which reduces the cross section for close encounters compared to BHs (Sect. 3.2).
A significant fraction of binary induced micro-TDEs is actually triggered by SN kick, which accounts for ≈55% of all events. However, 3D hydrodynamical simulations of newly formed NS-star binaries by Hirai & Podsiadlowski (2022) show that partial tidal disruptions can occur when the companion star is less massive than the NS, otherwise full disruptions are unlikely to occur. In our simulations, such systems involving low mass stars (see Fig. 10) represent only about ≈9% of the SN-kick subsample.
Most of the stars involved are MS (54%), followed by a substantial fraction of naked Helium stars (42.6%) and a few giants (3%) and 0.4% WDs. Star masses range between 0.02 M⊙ and 33 M⊙, while the NSs, as described by the adopted model (Fryer et al. 2012), span mass ranges between 1 and 3 M⊙.
As for BHs, the overall efficiency shows no strong dependence on metallicity or cluster mass. In the case of NSs, the dependence on the cluster central density is also weak (within a factor of ≈1.1). This behaviour can be understood by considering the interplay between the two dominant channels: While the multiple interaction channel becomes more efficient at higher densities, the kick-induced channel becomes less efficient. The latter requires relatively wide binaries to survive until the SN event, but such systems are more likely to be disrupted in denser environments. For BHs, the kick-induced channel is sub-dominant by more than an order of magnitude (Figure 7), so the overall trend still follows an increase of micro-TDEs with density.
In contrast, for NSs, the kick channel accounts for roughly half of all events, effectively balancing the density dependence and resulting in a flatter overall trend.
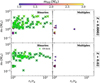 |
Fig. 10 Same as Fig. 4 but for micro-TDE induced by NSs for the two channels: binaries (left panel, where green cross refer to SN-kick triggered events) and multiples (right panel). |
4 Discussion
4.1 Comparison with previous works
A recent study by Kremer et al. (2021), based on Monte Carlo (MC) simulations of YSCs, investigated micro-TDEs of BH-MS stars arising from both single and binary-mediated dynamical encounters. For the single-encounter channel, they predicted a micro-TDE event rate at z = 0 of the order of 1-30 Gpc−3 yr−1, depending on the initial cluster radius (either fixed at rh = 1 pc or following the Marks & Kroupa 2012 relation). In our work, we estimate a rate from single encounters (see Fig. 8, yellow line) of approximately 10 Gpc−3 yr−1, in good agreement with their predictions.
In the same study, they also estimated a significantly higher rate for binary-mediated micro-TDEs, reaching ≈20– 160 Gpc−3 yr−1. These events arise exclusively from resonant interactions between dynamically formed BBHs and MS stars, as no primordial binaries were included in their models. Their result therefore reflects only the contribution of dynamical BBH-MS encounters and not the full binary-mediated channel.
In contrast, our simulations yield a higher rate for the multiple channel (Fig. 8, blue curve), reaching ≈300–400 Gpc−3 yr−1. The discrepancy with Kremer et al. (2021) can be attributed to two main factors: (i) we initialise YSCs with primordial binaries, and (ii) our estimate includes a broader range of BH-star configurations (see Sect. 3.4), beyond the specific BBH+MS interactions considered in their work.
In addition, although our simulations include a variety of stellar types, the vast majority of disrupted stars across the various channels are, as found also by Kremer et al. (2021), MS (90%), followed by giants (9%) and WDs (1%). As a result, the different stellar types do not significantly affect the comparison between different rate estimate.
Alternative families of stellar clusters have been considered as nurseries of micro-TDEs, such as GCs and OCs. Perets et al. (2016) and Kremer et al. (2019), using analytical and MC simulations, predicted a micro-TDE rate in GCs of the order of ≈10 Gpc−3 yr−1. Rastello et al. (2019), through N-body simulations, estimated that micro-TDEs involving BBHs in the central regions of OCs could occur at a rate of ≈3–30 Gpc−3 yr−1. Although these studies explore different micro-TDE formation channels, employ distinct methodologies, and focus on different stellar environments, our results together with (Kremer et al. 2021), suggests that YSCs are likely the dominant producers of micro-TDEs.
For micro-TDEs induced by NSs, assuming a MW star formation rate of SFR ≈1–2 M⊙yr−1 (Chomiuk & Povich 2011), we estimate an NS micro-TDE rate of ∼1–2 × 10⁻⁵ yr−1 per MW-like galaxy. Our results for YSCs are consistent with those reported by Michaely et al. (2016), who predict similar rates (∼1–2 × 10⁻⁵ yr−1) depending on the natal kick prescription.
In contrast for GCs, earlier analytical estimates by Perets et al. (2016) and Kremer et al. (2019) suggested significantly lower NS micro-TDE rates. Specifically, Perets et al. (2016) derived a rate of ∼3.4–4.8 × 10⁻⁷ yr−1 per MW-like galaxies, roughly an order of magnitude below their corresponding estimate for BH micro-TDEs. Kremer et al. (2019) report an even lower rate of ∼10−8 yr−1.
This is likely because the GCs in their study contain a significant BH population, which reduces the central density of stars and NSs. GCs that have dynamically ejected all their BHs appear as core collapsed in their luminosity profile (Breen & Heggie 2013) (approximately 20% of all GCs, Djorgovski & King 1986) and have central densities of ∼106−7 M⊙ pc−3 (e.g., den Brok et al. 2014; Gieles et al. 2018). The micro-TDE rate on NSs is likely orders of magnitude higher in such GCs.
Our findings on the importance of the multiple–star channel are in line with the recent results of Shariat et al. (2025), who demonstrated that BH–MS systems formed in triple configurations can reach extreme eccentricities, with a subset potentially producing micro-TDE-like episodes. Their evolutionary scenario, motivated by the triple system V404Cygni, provides independent theoretical support for the idea that triples may contribute non–negligibly to the micro–TDE population.
4.2 Full versus partial micro-TDE
To fully investigate the outcome of close encounters between stars and BHs, accurate hydrodynamical simulations are essential. Indeed, stars may be fully disrupted during the first pericentre passage, or they may undergo partial disruption (Perets et al. 2016), either remaining bound to the BH (i.e. forming a BH-star binary) or being completely unbound (Wevers & Ryu 2023). The specific outcome depends on complex physical processes, stellar density profiles and internal stellar structure details, which are beyond the scope of this work.
Our models are designed to capture all the possible channels through which such encounters can bring stars within the tidal disruption radius of COs. As such, the processes that led to micro-TDEs explored in this work can serve as a valuable library of initial conditions for future hydrodynamical simulations, allowing for more targeted investigations with reduced parameter space.
Here, we provide a first-order qualitative estimate of the fraction of full (FTDE) and partial (PTDE) micro-TDE candidates, based on the categories proposed by Kremer et al. (2022), who performed hydrodynamical simulations of close encounters between MS stars and mostly equal mass (mBH = 10 M⊙) BHs. By comparing our results (Fig. 11) with their Fig. 1, we find that, for both metallicities, approximately 20% of our candidates fall within the region associated with full disruption (black crosses in their Fig. 1), broadly corresponding to high penetrating encounters (β−1 < 0.5)5.
Among these candidate FTDEs, 85% originate from multiples, followed by 10% from single interactions, and binaries (5%). The remaining ≈80% of our candidates fall within the region corresponding to PTDEs, which can be either unbound, mostly involving low-mass MS stars (m∗ < 1 M⊙), or bound, typically associated with more massive stars (m∗ > 1 M⊙). This outcome is consistent with the results of hydrodynamical simulations by Vynatheya et al. (2024), who find that PTDEs, occurring at larger pericentre distances (i.e. larger β−1), are generally more common than FTDEs.
In addition to PTDEs and FTDEs, the process of tidal peeling may also occur, as suggested by the hydrodynamical simulations of Xin et al. (2024). This mechanism involves low-eccentricity encounters between BHs and stars, during which the star is gradually stripped of its outer layers over multiple orbits, rather than being disrupted in a single passage. Among the micro-TDEs identified in our simulations, those originating from primordial binaries and involving relatively massive stars (m∗ > 1 M⊙) on low-eccentric orbits (Sect. 3.4) may represent promising candidates for this process. A more detailed analysis of such cases will be presented in future work.
4.3 Collision versus micro-TDE fraction
To assess the dynamical relevance of micro-TDEs, we compared their occurrence rate with that of stellar collisions and CO coalescences (e.g. BBHs, BH-NSs and binary NSs) across clusters of different masses. By combining the simulation outcomes at Z = 0.0002 and Z = 0.02, we computed the fractions fcoll = Nmicro−TDE/NCOLL and fcoal = Nmicro−TDE/NCOAL splitting the clusters in four logarithmic mass bins spanning 103–105 M⊙.
We find that the fraction of stellar collisions resulting in TDEs remains nearly constant across all bins, with fcoll ≈ 0.004–0.008. Such value is mostly dominated by collisions of primordial binaries, while when excluding them, the collision fraction increases up to ≈0.1–0.4. This confirms that micro-TDEs are rare outcomes of stellar dynamical interactions, regardless of the cluster mass. In contrast, the TDE-to-coalescence ratio fcoal is significantly larger than unity, ranging from ≈5 to nearly 10 depending on the mass bin. This suggests that micro-TDEs dominate over CO mergers in number, especially in lower-mass clusters (MSC ≤ 104 M⊙ where the formation of CO binaries may be dynamically less efficient or delayed.
Assuming the ratios derived from our simulations, we estimate that the detection of roughly ≈10 micro-TDEs would imply the occurrence of roughly 1–2 CO coalescence. The combination of micro–TDE detections from upcoming wide-field surveys such as LSST (see Sect. 4.4) with the observed rates of CO mergers from GW detectors (Abbott et al. 2021, 2023; Mandel & Broekgaarden 2022) offers a promising channel to constrain the formation channels of GW sources. Since micro-TDEs can serve as tracers of the population of stellar-mass CO in dense SCs, their observed rate provides a valuable prior on the expected number of coalescence originating from the same environments.
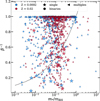 |
Fig. 11 Distribution of BH micro-TDEs in the plane defined by the stellar-to-BH mass ratio (m∗/mBH) and the inverse of the penetration factor (β−1). The micro-TDEs occurring in our simulated YSCs are shown using the same axes and parameter space as Figure 1 of Kremer et al. (2022). Each channel (see Sect. 3.1) is marked with a different symbol: single (stars), binaries (circles), and multiples (triangles). Blue for Z = 0.0002 and red for Z = 0.02. The dashed black line indicates the boundary for which (rp = r∗), where r∗ is the star radius. |
4.4 Detectability
To assess the detectability of BH micro-TDE events with current and upcoming optical and near-ultraviolet surveys, we focus on three representative cases: ZTF, LSST for the optical and ULTRASAT for the near-ultraviolet band. To this end, we combine the predicted event rates (Sect. 3.6) with the peak luminosities of micro-TDEs as derived from the wind-reprocessed models of Kremer et al. (2023). In these models, radiation generated by the accretion of disrupted stellar material onto the compact remnant is absorbed and re-emitted as thermal emission at larger radii. The predicted peak luminosities range from 1040 to 1043 erg s−1 in the optical (g-band) and near ultraviolet band (NUV), corresponding to absolute magnitudes from approximately −12 to −19. The peak luminosity is most sensitive to the treatment of disc winds, in particular the parameter “s”, which determines the fraction of stellar mass ejected in winds versus that accreted (see also Metzger et al. 2008; Metzger 2022)6. Following Kremer et al. (2023), we adopt three scenarios to bracket this uncertainty: pessimistic (s = 0.8, lowest peak luminosity), optimistic (s = 0.2, highest peak luminosity), and fiducial (s = 0.5). The amount of mass accreted onto the BH is based solely on the model of Kremer et al. (2023) and is independent of the 10% of stellar mass assumed to be accreted onto the BH in our simulations (see Sect. 2.2). As reported by Kremer et al. (2023), in the fiducial scenario only about 3% of the mass bound in the disc is ultimately accreted onto the BH, while this fraction increases up to 10% in the optimistic scenario. In Sect. 4.6.1 we discuss the impact of the assumed accretion efficiency on the detectability.
To estimate the band-specific peak luminosities for ZTF, LSST, and ULTRASAT, we use the values from Figure 11 of Kremer et al. (2023), assuming a disrupted stellar mass of 2 M⊙, close to the median in our simulations (see Table B.1). Although more massive stars (>10 M⊙) yield higher peak luminosities (by up to an order of magnitude), they contribute a small fraction of micro-TDE progenitors (<10% at Z = 0.0002, and <2% at Z = 0.02).
Given the assumed peak luminosities and survey limiting magnitudes, we computed the maximum redshift zmax at which a micro-TDE is detectable. The expected number of detections per year was modelled as a Poisson process a with mean:
 (7)
where Γ(zmax) is the cumulative event rate up to zmax (Eq. (4)), fsky is the effective sky fraction covered by the survey with a cadence suitable for detecting micro-TDEs (a few days, based on the light curves in Kremer et al. 2023), and ϵ is the recovery efficiency, i.e., the fraction of detectable events that are both identified and correctly classified as micro-TDEs. For simplicity, we assume ϵ = 1, although more realistic values likely range between 0.2 and 0.8 (LSST Science Collaboration 2009).
(7)
where Γ(zmax) is the cumulative event rate up to zmax (Eq. (4)), fsky is the effective sky fraction covered by the survey with a cadence suitable for detecting micro-TDEs (a few days, based on the light curves in Kremer et al. 2023), and ϵ is the recovery efficiency, i.e., the fraction of detectable events that are both identified and correctly classified as micro-TDEs. For simplicity, we assume ϵ = 1, although more realistic values likely range between 0.2 and 0.8 (LSST Science Collaboration 2009).
We drew 104 samples from the posterior distribution of Γ(zmax) and computed the number of yearly detections by sampling from a Poisson distribution with mean θ for each case. This approach incorporates both statistical and systematic uncertainties in the event rates. As with the rate estimates (Figure 8), we repeat the analysis separately for low- and high-density clusters to explore the dependence on cluster properties. The survey properties (limiting magnitudes, sky fractions) and the summary statistics of Γ(zmax) posteriors are reported in Appendix B.2.
Figure 12 summarises the expected number of micro-TDE detections per year for ZTF, ULTRASAT, and LSST, under three scenarios for the peak luminosity. In the optimistic case, all surveys show significantly higher detection rates, with ULTRA-SAT and LSST predicting up to thousands of events per year. In contrast, the fiducial scenario yields rates nearly an order of magnitude lower, while in the pessimistic case, the detection of micro-TDEs becomes unlikely for both ZTF and ULTRASAT.
ZTF has been operational for nearly six years, during which only one candidate micro-TDE has been reported (ZTF19aailpwl, Frederick et al. 2021). However, this event is not strictly consistent with the population considered in our study, as it occurred at z = 0.35 and is associated with an AGN. Excluding this candidate, the observed number of micro-TDEs with ZTF remains zero over six years, a result that aligns with our fiducial and pessimistic models when extrapolated over that timescale.
The large number of expected detections with LSST, even under pessimistic assumptions, highlights its potential to systematically explore the micro-TDE population. The assumed peak luminosity is the dominant source of uncertainty, with detection rate predictions differing by over an order of magnitude across the three scenarios, even after accounting for uncertainties in the intrinsic event rates (Sect. 3.6).
As a result, the number of micro-TDE detections with LSST and ULTRASAT could serve as a powerful diagnostic of the accretion and radiative reprocessing physics in these systems. If LSST or ULTRASAT detect thousands of events per year, it would be difficult to reconcile this with ZTF’s historical lack of detections, placing constraints on the optimistic scenario. Conversely, a lack of detections in LSST would strongly challenge both our simulation results and the emission models of Kremer et al. (2023).
A more detailed comparison between observational outcomes and theory would also benefit from incorporating alternative micro-TDE formation environments, such as GCs and AGNe. However, based on our simulations and existing literature (Perets et al. 2016; Kremer et al. 2019, 2021, 2023), YSCs appear to dominate the micro-TDE production. Thus, we do not expect a substantial shift in detection rates when including other environments.
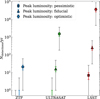 |
Fig. 12 Expected number of BH micro-TDE detections per year for three surveys (ZTF, ULTRASAT, and LSST) under different assumptions for the peak luminosity, based on the wind-reprocessed emission models of Kremer et al. (2023) (see main text for details). Symbols indicate the median of the posterior distribution computed using the full simulated sample, while thick coloured error bars show the 68% credible interval. Thin grey error bars represent the range of systematic uncertainties, bracketed by the 0.15th and 99.85th percentiles of the distributions obtained from simulations restricted to low-density and high-density clusters, respectively (see Sect. 3.5). Not visible symbols and bars indicate 0 detections. |
4.5 Implications for gravitational wave astronomy
The TDEs and micro-TDEs are multi-messenger sources (Wevers & Ryu 2023). In addition to EM emission, these transients are expected to produce GWs. During a TDE, when an ‘unlucky’ star is torn apart, it generates a short burst-like GW signal resulting from the time variation of the mass quadrupole of the BH-star system (Kobayashi et al. 2004; East 2014; Toscani et al. 2020; Pfister et al. 2022; Toscani et al. 2022, 2025).
This GW burst is characterised by an amplitude, hTDE, and a frequency, fTDE:
 (8)
(8)
 (9)
(9)
Here, β is the penetration factor, m∗ and r∗ are the mass and radius of the disrupted star, mBH is the mass of the BH, and d is the luminosity distance to the source.
Following the analytical description presented in Toscani et al. (2020, their Eqs. (3)–(7))7, we derived the expected GW emission signal of micro-TDEs (Fig. 13). We considered MS and WD stars disrupted by stellar-mass BHs (mBH = 3–100 M⊙).
The GW signal expected from disrupted WDs falls within the deci-hertz band, and future instruments such as LGWA and DECIGO will be capable of detecting such signals out to large distances, including the most extreme events up to redshift z = 1.
For MS stars, being less compact than WDs, the GW signal peaks at lower frequencies and is generally fainter, making only nearby events (within 1–16 Mpc) detectable by observatories such as DECIGO. Although micro-TDEs produce fainter GW signals than classical TDEs (mainly because they involve lighter BHs masses, see Eqs. (8) and (9)), they remain promising targets for next-generation GW observatories. Despite their lower amplitude, these events could play a key role in unveiling the presence of otherwise invisible BHs, even in distant galaxies across cosmic time.
In the context of GW detections, previous studies have shown that close encounters between stars and BBHs can perturb the binary orbit and potentially trigger coalescence (e.g., Ryu et al. 2022; Rastello et al. 2019; Lopez et al. 2019), suggesting that micro-TDEs could serve as the EM counterparts to GW signals from BBH mergers. In this case the GW signal is produced by the BBH merger rather than the stellar disruption itself. In our simulations we found that small a fraction of events (3%), limited to metal-poor YSCs, involves BHs that first produce a micro-TDE and later merge with another BH. However, because of the long delay time between the two events, none of the cases of merging BBHs recorded in our simulations are directly triggered by the micro-TDEs.
4.6 Caveats
4.6.1 Uncertainties on TDE modelling
To allow for integration within PETAR, our micro-TDE prescriptions necessarily adopt simplified assumptions (Sect. 2.2). First, we treat all encounters with rp < rt as full disruptions, and we neglect possible partial disruption and tidal captures for rp ≳ rt. Hydrodynamical works shows that not all the cases in which the pericentre is within the tidal radius produce a full disruption, and that partial disruption can be triggered up to about twice the tidal radius (e.g. Ryu et al. 2020; Kremer & Lombardi 2022). In gravitational focused regime, the number of TDEs is expected to scale linearly with the interaction scale length. Therefore, we could expect up to twice the events detected in our simulations. However, many systems with rp = rt approach this value through repeated perturbations, so the expected increase in production efficiency would be smaller than the nominal factor. In any case, partial TDEs (especially those with a minimum distance larger than the nominal tidal radius) produce less bound debris and lower fallback rates. Therefore, the peak luminosities are lower and harder to detect. Therefore the two effects tend to balance out, and we do not expect a significant impact on the estimate detectability of the events. Even in the case a significant fraction of our events are partial TDEs (up to 80%, see discussion in Sect. 4.2), the resulting rates would remain within the large uncertainties discussed in this work, and LSST could still detect from a few to several tens of events per year. The removal of the star has a negligible impact on the dynamical evolution of the cluster, as TDEs are rare and most disrupted stars have m⋆ < 2 M⊙ (see Table B.1 ). Second, in our TDE modelling we assume a constant accretion fraction of 10% of the stellar mass onto the CO. The actual accreted mass is highly uncertain for interactions between stars and COs (including TDEs, collisions, and common-envelope phases): the assumed accreted fraction in the literature spans a wide range, from 0 (a standard assumption in many population-synthesis codes; see, e.g., Iorio et al. 2023) to 100% (e.g., Kıroğlu et al. 2025a,b). Other N-body studies typically assume intermediate values, such as 10% (e.g., Rastello et al. 2019) or 50% (e.g., Rantala et al. 2025). Accretion models for micro-TDEs indicate that the process is generally inefficient, with only a small fraction of the bound stellar debris being ultimately accreted (Kremer et al. 2023; Kıroğlu et al. 2023). Therefore, the 10% of the total stellar mass adopted in our work should be regarded as an upper limit. The typical mass ratio of the TDEs in our simulations is ≲ 0.2, (see Table B.1) so even assuming 100% accretion would not significantly affect either the BH mass or the overall cluster dynamics. Importantly, our detectability analysis in Sect. 4.4 is independent of the specific accretion fraction assumed in the PETAR simulations. It is instead based on the wind-regulated emission model of Kremer et al. (2023), where the uncertainties are bracketed by varying the outflow-efficiency parameter s.
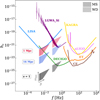 |
Fig. 13 Expected frequency ( f ) and characteristic strain (hc) of the GW signal produced by micro-TDEs involving an MS star (mMS = 0.5 M⊙, hatched bands) and a WD (mWD = 1.4 M⊙, solid coloured bands), shown at three reference distances:∼1 Mpc (red), ∼16 Mpc (blue), and z = 1 (grey). The two grey arrows in the lower-left corner indicate the directions of increasing BH mass (mBH) and penetration factor (β ≡ rt/rp). These predictions are overlaid with the sensitivity curves of current and future GW detectors: LGWA (purple; Harms et al. 2021), LISA (sky blue; Amaro-Seoane et al. 2017), DECIGO (green; Sato et al. 2017), Kamioka Gravitational Wave Detector (KAGRA, gold; Abbott et al. 2021), the Einstein Telescope (ET, orange; Maggiore et al. 2020), the Advanced Laser Interferometer Gravitational-Wave Observatory (LIGO, violet; Abbott et al. 2017), and the Cosmic Explorer (CE, brown; Ng et al. 2021). |
4.6.2 Relativistic kicks and post-Newtonian terms
The version of the code PETAR used to performed the N-body simulations presented in this work, does not account for relativistic recoil kicks. These kicks arise from the asymmetric emission of GWs during the coalescence of BBHs, that imparts a velocity to the remnant BH in order to conserve linear momentum. The magnitude of the recoil depends on the mass ratio and spin configuration of the merging BHs, and can reach several thousand km s−1 (Schnittman & Buonanno 2007).
Such high velocities can easily exceed the escape speed of YSCs, which is typically of the order of ∼10–50 km s−1 (Portegies Zwart et al. 2010). As a consequence, BHs that undergo coalescence in YSCs are likely ejected before they can participate in further dynamical interactions or disrupt stars. Only dense and massive environments such as NSCs or AGN disc, where escape velocities are higher (Antonini et al. 2019), can retain a significant fraction of post-merger BHs.
To assess the impact of neglecting recoil kicks on our results, we examined the properties of the BHs involved in micro-TDEs in our simulations. Among all micro-TDEs occurring in metal-poor YSCs, 4% involve a BH that is the remnant of a previous BBH coalescence, where the merger occurred prior to the micro-TDE. For Solar-metallicity YSCs, this fraction drops to 0.8%. Given these small numbers, we conclude that the absence of recoil kicks in PETAR does not significantly affect the main conclusions of this work.
The code used in this work, PETAR, models the orbital decay of coalescing BBHs, due to GW emission using the Peters’ equations (Peters 1964). However, the code does not include post-Newtonian corrections for strong, unbound (e.g., hyperbolic) encounters. While we do not expect major changes in the overall event statistics, a dedicated follow-up analysis using relativistic few-body integrators is planned to assess their potential impact on the dynamics and outcomes of micro-TDEs.
4.7 Maximum integration time
The YSCs analysed in this study were integrated with PETAR up to approximately ≈1.5 Gyr, ensuring that each cluster, given its initial size and mass, experienced at least one relaxation time (see Sect. 2.1). Micro-TDEs triggered by SN kicks occur earliest, as expected, with all such events taking place within the first ∼10 Myr, immediately following BH formation (see Table B.1).
Events originating from single or binary mediated encounters, as well as from higher-order multiples, exhibit a broader distribution in time. Nevertheless, the majority (about 85%) of all micro-TDEs occur within the first ≈800 Myr of SC evolution. A small number of late-time events (up to ≈1.1 Gyr) are also present, particularly in more massive YSCs (MSC ≈ 105 M⊙).
However the cumulative number of micro-TDEs typically saturates around ≈1 Gyr, indicating that the adopted integration time (≈1.5 Gyr) is sufficient to capture the effective timescale over which stellar disruptions occur. Simulating the clusters for longer timescales would likely not alter the global picture emerging from our results.
5 Summary and conclusions
In this paper, we have studied the demography of micro-TDEs occurring in metal-poor and metal-rich YSCs. We carried out a suite of direct N-body simulations using a customised version of the code PETAR, in which we include a prescription for TDEs (see Appendix A).
Our cluster models span a range of initial masses, densities, and half-mass radii designed to cover the observed properties of the MW’s YSC population as described by Krumholz et al. (2019). Each cluster was initialised with a King density profile and a mass-dependent ‘primordial’ binary fraction following Moe & Di Stefano (2017). The clusters were embedded in the Galactic tidal field and evolved up to 1.5 Gyr.
We identified all events in which a star, either in a close encounter or in a bound orbit, crosses within the tidal disruption radius of a CO, i.e. a BH or an NS (see Eq. (2)), and we distinguished three dynamical channels leading to micro-TDEs: single encounters, binary-mediated interactions including an SN-kick trigger, and higher-order multiple systems. For each channel, we estimated the corresponding efficiency and volumetric rate.
The main findings of our work are summarised below:
Micro-TDEs produced by a single encounter between stars and BHs are rare at both metallicities, with efficiency of the order of
 ;
;The binary channel is relatively rare, contributing to only 7% of the total sample, and it exhibits low efficiency, particularly at high metallicity (
 ; see Sect. 3.3). It accounts for the majority of ‘primordial’ binaries (about 70%), where micro-TDEs are primarily driven by stellar evolution processes, such as (CE) evolution, (MT), or supernova kicks, rather than by dynamical interactions. A small fraction of events (≈1.6%) are directly triggered by an SN explosion;
Multiple encounters and interactions in hierarchical triples or quadruples are the most efficient channel to produce micro-TDEs in YSCs
 . Half of the triples and quadruples leading to micro-TDEs host at least two BHs or BBHs;
Overall, the production efficiency of BH micro-TDEs is largely independent of metallicity, but it increases with the initial density of the cluster due to the higher frequency of dynamical interactions (see Sect. 3.5);
Given the estimated efficiencies, the volumetric rate of micro-TDEs of BHs is estimated to rise from 250–450 Gpc−3 yr−1 at z = 0 up to 2000–3000 Gpc−3 yr−1 at z = 2. The highest contribution (≈90%) comes from the multiple encounters channel (Fig. 8, blue curve) and is followed by the binaries and single channels (≈9%, Fig. 8, magenta and yellow line). Kick-induced micro-TDEs account for the lowest rate (≈9%);
Among the population of all micro-TDEs in YSCs, 20% involve NSs (Sect. 3.7). Due to their lower interaction efficiency
 , micro-TDEs involving NSs occur at a reduced rate compared to those involving BHs, namely, of the order of 1–2×10⁻⁵ yr−1 per MW galaxy;
We assessed the detectability of micro-TDEs by combining our predicted event rates with models for wind-reprocessed emission proposed by Kremer et al. (2023). We find that LSST is the most promising instrument to unveil the micro-TDE population in YSCs. Indeed, assuming a peak luminosity of ∼1040–1043 erg s−1, LSST is expected to detect from tens to several tens of thousands of micro-TDEs per year;
Following the prescription of Toscani et al. (2020), we estimated the GW emission expected from micro-TDEs. The GW signal is predicted to peak in the deci-Hertz band. Future instruments such as DECIGO and LGWA will be particularly suited to detect these events, especially the closest ones involving the disruption of WDs.
The inferred rate of micro-TDEs can provide indirect constraints on the number of stellar collisions in SCs, and can be used to make predictions about the expected population of dormant BHs, CO mergers, or other compact remnants.
Micro-TDEs are promising multi-messenger sources that may be detectable by forthcoming EM and GW surveys. Our work represents an extensive study of such transients in YSCs, and it is the first to systematically explore their formation channels and rates through direct N-body simulations over a wide range of initial cluster conditions. To fully capture the complex physical processes involved in these close encounters, future work should include detailed hydrodynamical simulations, ideally incorporating general relativistic effects, in combination with accurate few-body Newtonian dynamical modelling.
Data availability
The code used for this study is available at the following link https://gitlab.com/sara_rastello_astro/PeTar_TDE_SR. The simulation data underlying the results presented in this work will be shared upon reasonable request to the corresponding author. The simulation data underlying the results presented in this work will be shared upon reasonable request to the corresponding author.
Acknowledgements
We thank the anonymous referee for the useful comments and suggestions, which helped us to improve the manuscript. SR gratefully acknowledges helpful discussions with Taeho Ryu, Kyle Kremer, Martina Toscani, Filippo Santoliquido, Alessandro Alberto Trani, Pavan Vynatheya, Manuel Arca Sedda, Matt Nicholl, Brenna Mockler, Giuseppe Lodato, Daniel Price, Michela Mapelli, Daniel Marín Pina, Helena Ubach, and Kristen Dage. SR is also thankful to the Virgo and Gaia groups at ICCUB for valuable discussions. SR sincerely thanks Francesca for her constant and invaluable support. SR further acknowledges financial support from the Beatriu de Pinós postdoctoral fellowship program under the Ministry of Research and Universities of the Government of Catalonia (Grant Reference No. 2021 BP 00213). GI is supported by a fellowship grant from la Caixa Foundation (ID 100010434). The fellowship code is LCF/BQ/PI24/12040020. MG acknowledges financial support from grants PID2021-125485NB-C22, PID2024-155720NB-I00 funded by MCIN/AEI/10.13039/501100011033 and SGR-2021-01069 (AGAUR). SR, GI and MG acknowledge financial support from grants CEX2019-000918-M, CEX2024-001451-M funded by MICIU/AEI/10.13039/501100011033. LW thanks the support from the National Natural Science Foundation of China through grant 21BAA00619 and 12233013, the High-level Youth Talent Project (Provincial Financial Allocation) through the grant 2023HYSPT0706, the one-hundred-talent project of Sun Yat-sen University. This research benefited from scientific interactions during workshops at the Kavli Institute for Theoretical Physics, supported in part by NSF Grant PHY-2309135, and at the Munich Institute for Astro-, Particle and BioPhysics (MIAPbP), which is funded by the Deutsche Forschungsgemeinschaft (DFG, German Research Foundation) under Germany’s Excellence Strategy – EXC-2094 – 390783311. We thankfully acknowledge the computing resources provided by the Red Española de Super-computación (RES) under the projects AECT-2023-3-0015, AECT-2024-2-0037, AECT-2024-3-0017, and AECT-2025-1-0028. This includes access to the Turgalium supercomputer at CETA-CIEMAT, and the AGUSTINA–CESAR cluster at the BIFI Institute (University of Zaragoza). SR and GI acknowledge the use of the NYX supercomputing cluster at ICCUB.
References
- Abbott, B. P., Abbott, R., Abbott, T. D., et al. 2017, Phys. Rev. Lett., 118, 121102 [Google Scholar]
- Abbott, R., Abbott, T. D., Abraham, S., et al. 2020, ApJ, 896, L44 [Google Scholar]
- Abbott, R., Abbott, T. D., Abraham, S., et al. 2021, Phys. Rev. X, 11, 021053 [Google Scholar]
- Abbott, R., Abbott, T. D., Acernese, F., et al. 2023, Phys. Rev. X, 13, 041039 [Google Scholar]
- Amaro-Seoane, P., Audley, H., Babak, S., et al. 2017, arXiv e-prints [arXiv:1702.00786] [Google Scholar]
- Antonini, F., Gieles, M., & Gualandris, A. 2019, MNRAS, 486, 5008 [NASA ADS] [CrossRef] [Google Scholar]
- Arca Sedda, M., Kamlah, A. W. H., Spurzem, R., et al. 2024, MNRAS, 528, 5119 [NASA ADS] [CrossRef] [Google Scholar]
- Astropy Collaboration (Price-Whelan, A. M., et al.) 2022, ApJ, 935, 167 [NASA ADS] [CrossRef] [Google Scholar]
- Avakyan, A., Neumann, M., Zainab, A., et al. 2023, A&A, 675, A199 [NASA ADS] [CrossRef] [EDP Sciences] [Google Scholar]
- Balbinot, E., Dodd, E., Matsuno, T., et al. 2024, A&A, 687, L3 [NASA ADS] [CrossRef] [EDP Sciences] [Google Scholar]
- Banerjee, S., Belczynski, K., Fryer, C. L., et al. 2020, A&A, 639, A41 [NASA ADS] [CrossRef] [EDP Sciences] [Google Scholar]
- Belczynski, K., Bulik, T., Fryer, C. L., et al. 2010, ApJ, 714, 1217 [NASA ADS] [CrossRef] [Google Scholar]
- Belczynski, K., Heger, A., Gladysz, W., et al. 2016, A&A, 594, A97 [NASA ADS] [CrossRef] [EDP Sciences] [Google Scholar]
- Bellm, E. C., Kulkarni, S. R., Graham, M. J., et al. 2019, PASP, 131, 018002 [Google Scholar]
- Ben-Ami, S., Shvartzvald, Y., Waxman, E., et al. 2022, SPIE Conf. Ser., 12181, 1218105 [Google Scholar]
- Beniamini, P., Perets, H. B., & Granot, J. 2025, arXiv e-prints [arXiv:2509.22779] [Google Scholar]
- Bovy, J. 2015, ApJS, 216, 29 [NASA ADS] [CrossRef] [Google Scholar]
- Breen, P. G., & Heggie, D. C. 2013, MNRAS, 432, 2779 [NASA ADS] [CrossRef] [Google Scholar]
- Breivik, K., Chatterjee, S., & Larson, S. L. 2017, ApJ, 850, L13 [CrossRef] [Google Scholar]
- Chomiuk, L., & Povich, M. S. 2011, AJ, 142, 197 [Google Scholar]
- Costa, G., Shepherd, K. G., Bressan, A., et al. 2025, A&A, 694, A193 [NASA ADS] [CrossRef] [EDP Sciences] [Google Scholar]
- den Brok, M., van de Ven, G., van den Bosch, R., & Watkins, L. 2014, MNRAS, 438, 487 [Google Scholar]
- Di Carlo, U. N., Agrawal, P., Rodriguez, C. L., & Breivik, K. 2024, ApJ, 965, 22 [CrossRef] [Google Scholar]
- Djorgovski, S., & King, I. R. 1986, ApJ, 305, L61 [Google Scholar]
- Dong, S., Shappee, B. J., Prieto, J. L., et al. 2016, Science, 351, 257 [NASA ADS] [CrossRef] [Google Scholar]
- East, W. E. 2014, ApJ, 795, 135 [Google Scholar]
- El-Badry, K., Rix, H.-W., Cendes, Y., et al. 2023a, MNRAS, 521, 4323 [NASA ADS] [CrossRef] [Google Scholar]
- El-Badry, K., Rix, H.-W., Quataert, E., et al. 2023b, MNRAS, 518, 1057 [Google Scholar]
- Fragione, G., Leigh, N. W. C., Perna, R., & Kocsis, B. 2019, MNRAS, 489, 727 [Google Scholar]
- Fragione, G., Perna, R., & Loeb, A. 2021, MNRAS, 500, 4307 [Google Scholar]
- Frederick, S., Gezari, S., Graham, M. J., et al. 2021, ApJ, 920, 56 [NASA ADS] [CrossRef] [Google Scholar]
- Fregeau, J. M., & Rasio, F. A. 2007, ApJ, 658, 1047 [Google Scholar]
- Fryer, C. L., Belczynski, K., Wiktorowicz, G., et al. 2012, ApJ, 749, 91 [Google Scholar]
- Gaia Collaboration (Panuzzo, P., et al.) 2024, A&A, 686, L2 [NASA ADS] [CrossRef] [EDP Sciences] [Google Scholar]
- Gelman, A., Carlin, J. B., Stern, H. S., et al. 2014, Bayesian Data Analysis Gezari, S. 2021, ARA&A, 59, 21 [Google Scholar]
- Gieles, M., & Zocchi, A. 2015, MNRAS, 454, 576 [NASA ADS] [CrossRef] [Google Scholar]
- Gieles, M., Heggie, D. C., & Zhao, H. 2011, MNRAS, 413, 2509 [Google Scholar]
- Gieles, M., Balbinot, E., Yaaqib, R. I. S. M., et al. 2018, MNRAS, 473, 4832 [CrossRef] [Google Scholar]
- Gieles, M., Erkal, D., Antonini, F., Balbinot, E., & Peñarrubia, J. 2021, Nat. Astron., 5, 957 [NASA ADS] [CrossRef] [Google Scholar]
- Giesers, B., Dreizler, S., Husser, T.-O., et al. 2018, MNRAS, 475, L15 [NASA ADS] [CrossRef] [Google Scholar]
- Graham, M. J., Kulkarni, S. R., Bellm, E. C., et al. 2019, PASP, 131, 078001 [Google Scholar]
- Guillochon, J., & Ramirez-Ruiz, E. 2013, ApJ, 767, 25 [NASA ADS] [CrossRef] [Google Scholar]
- Hammerstein, E., van Velzen, S., Gezari, S., et al. 2023, ApJ, 942, 9 [NASA ADS] [CrossRef] [Google Scholar]
- Harms, J., Ambrosino, F., Angelini, L., et al. 2021, ApJ, 910, 1 [NASA ADS] [CrossRef] [Google Scholar]
- Hills, J. G. 1975, AJ, 80, 1075 [NASA ADS] [CrossRef] [Google Scholar]
- Hirai, R., & Mandel, I. 2022, ApJ, 937, L42 [NASA ADS] [CrossRef] [Google Scholar]
- Hirai, R., & Podsiadlowski, P. 2022, MNRAS, 517, 4544 [Google Scholar]
- Hurley, J. R., Pols, O. R., & Tout, C. A. 2000, MNRAS, 315, 543 [Google Scholar]
- Hurley, J. R., Tout, C. A., & Pols, O. R. 2002, MNRAS, 329, 897 [Google Scholar]
- Iorio, G., Mapelli, M., Costa, G., et al. 2023, MNRAS, 524, 426 [NASA ADS] [CrossRef] [Google Scholar]
- Ivezić, Ž., Kahn, S. M., Tyson, J. A., et al. 2019, ApJ, 873, 111 [Google Scholar]
- Iwasawa, M., Tanikawa, A., Hosono, N., et al. 2016, PASJ, 68, 54 [NASA ADS] [CrossRef] [Google Scholar]
- Iwasawa, M., Namekata, D., Nitadori, K., et al. 2020, PASJ, 72, 13 [CrossRef] [Google Scholar]
- King, I. R. 1966, AJ, 71, 64 [Google Scholar]
- Kıroğlu, F., Lombardi, J. C., Kremer, K., et al. 2023, ApJ, 948, 89 [CrossRef] [Google Scholar]
- Kıroğlu, F., Kremer, K., Biscoveanu, S., González Prieto, E., & Rasio, F. A. 2025a, ApJ, 979, 237 [Google Scholar]
- Kıroğlu, F., Lombardi, J. C., Kremer, K., Vanderzyden, H. D., & Rasio, F. A. 2025b, ApJ, 983, L9 [Google Scholar]
- Kobayashi, S., Laguna, P., Phinney, E. S., & Mészáros, P. 2004, ApJ, 615, 855 [Google Scholar]
- Komossa, S. 2015, J. High Energy Astrophys., 7, 148 [Google Scholar]
- Kremer, K., & Lombardi, J. 2022, in AAS/High Energy Astrophysics Division, 19, 110.50 [Google Scholar]
- Kremer, K., Lu, W., Rodriguez, C. L., Lachat, M., & Rasio, F. A. 2019, ApJ, 881, 75 [NASA ADS] [CrossRef] [Google Scholar]
- Kremer, K., Lu, W., Piro, A. L., et al. 2021, ApJ, 911, 104 [CrossRef] [Google Scholar]
- Kremer, K., Lombardi, J. C., Lu, W., Piro, A. L., & Rasio, F. A. 2022, ApJ, 933, 203 [NASA ADS] [CrossRef] [Google Scholar]
- Kremer, K., Mockler, B., Piro, A. L., & Lombardi, J. C. 2023, MNRAS, 524, 6358 [NASA ADS] [CrossRef] [Google Scholar]
- Kroupa, P. 2001, MNRAS, 322, 231 [NASA ADS] [CrossRef] [Google Scholar]
- Krumholz, M. R., McKee, C. F., & Bland-Hawthorn, J. 2019, ARA&A, 57, 227 [Google Scholar]
- Lada, C. J., & Lada, E. A. 2003, ARA&A, 41, 57 [Google Scholar]
- Li, X., Sun, H., Zou, Y.-C., & Yang, H. 2026, ApJ, 996, 120 [Google Scholar]
- Lopez, M., Jr., Batta, A., Ramirez-Ruiz, E., Martinez, I., & Samsing, J. 2019, ApJ, 877, 56 [NASA ADS] [CrossRef] [Google Scholar]
- LSST Science Collaboration (Abell, P. A., et al.) 2009, arXiv e-prints [arXiv:0912.0201] [Google Scholar]
- Madau, P., & Fragos, T. 2017, ApJ, 840, 39 [Google Scholar]
- Maggiore, M., Van Den Broeck, C., Bartolo, N., et al. 2020, J. Cosmology Astropart. Phys., 2020, 050 [CrossRef] [Google Scholar]
- Mandel, I., & Broekgaarden, F. S. 2022, Liv. Rev. Relativ., 25, 1 [NASA ADS] [CrossRef] [Google Scholar]
- Marín Pina, D., Rastello, S., Gieles, M., et al. 2024, A&A, 688, L2 [NASA ADS] [CrossRef] [EDP Sciences] [Google Scholar]
- Marín Pina, D., Gieles, M., Rastello, S., & Iorio, G. 2025, arXiv e-prints [arXiv:2510.07021] [Google Scholar]
- Marks, M. & Kroupa, P. 2012, A&A, 543, A8 [NASA ADS] [CrossRef] [EDP Sciences] [Google Scholar]
- Metzger, B. D. 2022, ApJ, 932, 84 [NASA ADS] [CrossRef] [Google Scholar]
- Metzger, B. D., Piro, A. L., & Quataert, E. 2008, MNRAS, 390, 781 [NASA ADS] [Google Scholar]
- Michaely, E., Ginzburg, D., & Perets, H. B. 2016, arXiv e-prints [arXiv:1610.00593] [Google Scholar]
- Miyamoto, M., & Nagai, R. 1975, PASJ, 27, 533 [NASA ADS] [Google Scholar]
- Moe, M., & Di Stefano, R. 2017, ApJS, 230, 15 [Google Scholar]
- Naoz, S., Haiman, Z., Quataert, E., & Holzknecht, L. 2025, ApJ, 992, L12 [Google Scholar]
- Navarro, J. F., Frenk, C. S., & White, S. D. M. 1997, ApJ, 490, 493 [Google Scholar]
- Ng, K. K. Y., Vitale, S., Farr, W. M., & Rodriguez, C. L. 2021, ApJ, 913, L5 [NASA ADS] [CrossRef] [Google Scholar]
- Nicholl, M., Srivastav, S., Fulton, M. D., et al. 2023, ApJ, 954, L28 [Google Scholar]
- Oshino, S., Funato, Y., & Makino, J. 2011, PASJ, 63, 881 [NASA ADS] [Google Scholar]
- Perets, H. B., Li, Z., Lombardi, James C.J., & Milcarek, Stephen R. J. 2016, ApJ, 823, 113 [NASA ADS] [CrossRef] [Google Scholar]
- Peters, P. C. 1964, Phys. Rev., 136, 1224 [Google Scholar]
- Pfister, H., Toscani, M., Wong, T. H. T., et al. 2022, MNRAS, 510, 2025 [Google Scholar]
- Planck Collaboration VI. 2020, A&A, 641, A6 [NASA ADS] [CrossRef] [EDP Sciences] [Google Scholar]
- Portegies Zwart, S. F., McMillan, S. L. W., & Gieles, M. 2010, ARA&A, 48, 431 [Google Scholar]
- Rantala, A., Lahén, N., Naab, T., Escobar, G. J., & Iorio, G. 2025, MNRAS, 543, 2130 [Google Scholar]
- Rantala, A., Naab, T., & Lahén, N. 2024, MNRAS, 531, 3770 [NASA ADS] [CrossRef] [Google Scholar]
- Rastello, S., Amaro-Seoane, P., Arca-Sedda, M., et al. 2019, MNRAS, 483, 1233 [NASA ADS] [CrossRef] [Google Scholar]
- Rastello, S., Mapelli, M., Di Carlo, U. N., et al. 2020, MNRAS, 497, 1563 [CrossRef] [Google Scholar]
- Rastello, S., Mapelli, M., Di Carlo, U. N., et al. 2021, MNRAS, 507, 3612 [CrossRef] [Google Scholar]
- Rastello, S., Iorio, G., Mapelli, M., et al. 2023, MNRAS, 526, 740 [NASA ADS] [CrossRef] [Google Scholar]
- Ray, A., Farr, W., & Kalogera, V. 2025, arXiv e-prints [arXiv:2507.09099] [Google Scholar]
- Rees, M. J. 1988, Nature, 333, 523 [Google Scholar]
- Ryu, T., Krolik, J., Piran, T., & Noble, S. C. 2020, ApJ, 904, 99 [NASA ADS] [CrossRef] [Google Scholar]
- Ryu, T., Perna, R., & Wang, Y.-H. 2022, MNRAS, 516, 2204 [NASA ADS] [CrossRef] [Google Scholar]
- Ryu, T., Perna, R., Pakmor, R., et al. 2023a, MNRAS, 519, 5787 [CrossRef] [Google Scholar]
- Ryu, T., Valli, R., Pakmor, R., et al. 2023b, MNRAS, 525, 5752 [NASA ADS] [CrossRef] [Google Scholar]
- Ryu, T., de Mink, S. E., Farmer, R., et al. 2024, MNRAS, 527, 2734 [Google Scholar]
- Sagiv, I., Gal-Yam, A., Ofek, E. O., et al. 2014, AJ, 147, 79 [NASA ADS] [CrossRef] [Google Scholar]
- Samsing, J., Venumadhav, T., Dai, L., et al. 2019, Phys. Rev. D, 100, 043009 [Google Scholar]
- Sato, S., Kawamura, S., Ando, M., et al. 2017, Journal of Physics Conference Series, 840, 012010 [Google Scholar]
- Schnittman, J. D., & Buonanno, A. 2007, ApJ, 662, L63 [Google Scholar]
- Shariat, C., Naoz, S., El-Badry, K., et al. 2025, ApJ, 983, 115 [Google Scholar]
- Shenar, T., Sana, H., Mahy, L., et al. 2022a, Nat. Astron., 6, 1085 [NASA ADS] [CrossRef] [Google Scholar]
- Shenar, T., Sana, H., Mahy, L., et al. 2022b, A&A, 665, A148 [NASA ADS] [CrossRef] [EDP Sciences] [Google Scholar]
- Shvartzvald, Y., Waxman, E., Gal-Yam, A., et al. 2024, ApJ, 964, 74 [NASA ADS] [CrossRef] [Google Scholar]
- Tanikawa, A., Hattori, K., Kawanaka, N., et al. 2023, ApJ, 946, 79 [CrossRef] [Google Scholar]
- Torniamenti, S., Rastello, S., Mapelli, M., et al. 2022, MNRAS, 517, 2953 [NASA ADS] [CrossRef] [Google Scholar]
- Torniamenti, S., Gieles, M., Penoyre, Z., et al. 2023, MNRAS, 524, 1965 [NASA ADS] [CrossRef] [Google Scholar]
- Toscani, M., Rossi, E. M., & Lodato, G. 2020, MNRAS, 498, 507 [Google Scholar]
- Toscani, M., Lodato, G., Price, D. J., & Liptai, D. 2022, MNRAS, 510, 992 [Google Scholar]
- Toscani, M., Broggi, L., Sesana, A., & Rossi, E. M. 2025, A&A, 703, A75 [NASA ADS] [CrossRef] [EDP Sciences] [Google Scholar]
- Tsuna, D. & Lu, W. 2025, ApJ, 986, 84 [Google Scholar]
- Vink, J. S., de Koter, A., & Lamers, H. J. G. L. M. 2001, A&A, 369, 574 [NASA ADS] [CrossRef] [EDP Sciences] [Google Scholar]
- Virtanen, P., Gommers, R., Oliphant, T. E., et al. 2020, Nat. Methods, 17, 261 [Google Scholar]
- Vynatheya, P., Ryu, T., Pakmor, R., de Mink, S. E., & Perets, H. B. 2024, A&A, 685, A45 [NASA ADS] [CrossRef] [EDP Sciences] [Google Scholar]
- Wang, L., Iwasawa, M., Nitadori, K., & Makino, J. 2020a, MNRAS, 497, 536 [NASA ADS] [CrossRef] [Google Scholar]
- Wang, L., Nitadori, K., & Makino, J. 2020b, MNRAS, 493, 3398 [NASA ADS] [CrossRef] [Google Scholar]
- Wevers, T., & Ryu, T. 2023, arXiv e-prints [arXiv:2310.16879] [Google Scholar]
- Wyrzykowski, Ł., & Mandel, I. 2020, A&A, 636, A20 [NASA ADS] [CrossRef] [EDP Sciences] [Google Scholar]
- Xin, C., Haiman, Z., Perna, R., Wang, Y., & Ryu, T. 2024, ApJ, 961, 149 [NASA ADS] [CrossRef] [Google Scholar]
- Yang, Y., Bartos, I., Fragione, G., et al. 2022, ApJ, 933, L28 [Google Scholar]
Through this paper TDEs refer to events involving SMBHs; those involving stellar-COs are referred to as micro-TDEs.
This scenario is analogous to classical TDEs involving SMBHs.
We define naked helium stars as stars that have lost their hydrogen envelope either through strong stellar winds (typical in metal-rich environments) or binary interactions. See Hurley et al. (2000, 2002) for further details.
We estimated the integral using the quadrature method quad from the Python module scipy (Virtanen et al. 2020), and we computed the differential co-moving volume using the function differential_comoving_volume from the astropy module (Astropy Collaboration 2022).
Note that in this subsection and in Fig. 11 we use the inverse of the penetration factor, β−1, to enable direct comparison with the results from Kremer et al. (2022, Figure 1).
In those papers, the parameter s is instead denoted as p.
Following (Toscani et al. 2020), we also use here βmin = 1 (i.e., rp = rt) and βmax = rt/rs, where rs is the Schwarzschild radius of the BH.
Appendix A Updates on PETAR and TDE prescriptions
In the current version of PETAR (Wang et al. 2020a) , TDEs are not included. However, the code does implement a treatment for collisions, which occur when, at the point of closest approach (periastron), the sum of the radii of the two objects exceeds their distance:
 (A.1)
(A.1)
Here, rp is the periastron of the two-body orbit, which can be either bound or unbound. When the condition in Eq. (A.1) is met, PETAR passes the system to the stellar and binary evolution module, which determines the outcome of the interaction. Depending on the stellar types involved, the default stellar and binary evolution module BSE (see Section 2.2.1) may trigger a merger (if both stars are on the MS), a (CE) phase (if at least one star is evolved with a well-defined core-envelope structure), or the complete destruction of the star (in the case of a collision between a MS star and a COs).
From a practical perspective, TDEs can be seen as a generalisation of the stellar collision process. Therefore, we updated the code to include TDEs by introducing an additional condition that triggers a call to the stellar and binary evolution module. Specifically, a TDE is considered to occur if the periastron distance falls within the tidal disruption radius (see Eq. (2)). TDE interactions are only considered when the two interacting bodies consist of one star (WD) and one dense compact remnant (a BH or an NS). The outcome of the encounter is handled by the stellar and binary evolution module in the same way as for stellar collisions. Since one of the objects is a compact remnant, the TDE of a MS star (either hydrogen rich or helium rich) or a WD always results in the complete disruption of the star, with a fraction of its mass being accreted onto the CO (see Section 2.2.1). With respect to the original implementation we lower from 50% to 10% the amount of star mass accreted on a BH after a star destruction due to a collision or a TDE.
While developing and testing the TDE implementation, we realised that the default treatment of collisions in PETAR could lead to spurious mergers or (CE) events. Indeed, in the current setup, whenever the condition in Eq. (A.1 is satisfied, the code immediately calls the stellar and binary evolution module, which in turn triggers a merger or (CE) phase. This occurs regardless of the current physical separation between the two objects and without accounting for potential subsequent dynamical interactions. As a result, fluctuations in the relative energy and angular momentum of system of two stars, caused by nearby encounters or the influence of the overall cluster and background potential, can satisfy the collision condition in a single time-step, even if the two stars are still far apart or would never actually collide due to later perturbations.
To address this issue, our customised version of PETAR adds an additional safeguard for both TDEs and collisions: we require that the two objects either already fulfill the collision or TDE condition based on their current separation (i.e., replacing rp with the instantaneous distance in Eq. 2 and Eq. A.1) or that the pericentre will be reached within the current time-step. In case these conditions are not fulfilled PETAR will be informed of the time necessary to reach the periastron so that it can account it in handling the close encounter in the next simulation step. These extra conditions ensure that TDEs identified in our simulations reflect genuine physical encounters rather than transient fluctuations in two-body orbital parameters. The algorithm 1 presents the pseudocode of the new updated implementation for collision and TDE.
It is important to note that collisions and TDEs are checked within the part of the code that handles close encounters, binaries, and hierarchical systems. As a result, these conditions can be triggered for pairs of stars both in bound orbits and in unbound orbits, as well as during chaotic few-body interactions. See Section 3.1 for a detailed classification of these cases.
Appendix B Additional tables
Appendix B.1 Micro-TDE production efficiency of BHs
Table B.1 summarises the micro-TDE production efficiency per each channel and metallicity as discussed in Sect. 3.5.
Appendix B.2 Micro-TDE rates of BHs for ZTF, ULTRASAT, and LSST
Table B.2 summarises the properties and the posterior distribution of the micro-TDE rates of BHs (events per year) for the three surveys analysed in this work (Sect. 4.4): ZTF (Zwicky Transient Facility at Palomar Observatory; Bellm et al. 2019), LSST (Legacy Survey of Space and Time at the Vera C. Rubin Observatory; Ivezić et al. 2019), and ULTRASAT (a space-based NUV imaging mission; Sagiv et al. 2014; Shvartzvald et al. 2024).
For ZTF, we considered the Northern-equatorial sky survey with a reported mean limit magnitude of 20.5 in the g-band and a sky coverage of 15000 deg2 with 3 days cadence ( fsky = 0.364). For LSST, we considered the Wide Fast Deep survey with a mean limit magnitude of 25.0 in the g-band and a sky coverage of 19600 deg2 with 2-4 days cadence ( fsky = 0.364). For ULTRA-SAT, we considered the low cadence survey with a sky coverage of 6800 deg2 ( fsky = 0.165) and expected limit magnitude of 22.5 in the near ultraviolet band.
The rates and the sky fraction have been used in Sect. 4.4 (Eq. 7) to estimate the number of expected detection of micro-TDEs for each one of the three surveys.
| 1: | Input: Particles p1, p2, binary parameters _bin, timestep info |
|---|---|
| 2: | Determine object types t1 , t2 |
| 3: | Compute tidal radius rt based on star–compact object pair: |
| 4: | if t1 ∈ {Black Hole (BH), Neutron Star (NS)} and t2 ∉ {BH, NS} then |
| 5: | 
|
| 6: | else if t2 ∈ {BH, NS} and t1 ∉ {BH, NS} then |
| 7: | 
|
| 8: | else |
| 9: | rt ← −1 |
| 10: | end if |
| 11: | Compute pericentre radius rp = _bin.semi(1 − _bin.ecc) |
| 12: | if rt > 0 and rt > rp then ▷ Check for possible TDE |
| 13: | Compute current separation r |
| 14: | Compute current relative velocity v |
| 15: | if r < rt then |
| 16: | if _bin.semi < 0 then |
| 17: | Trigger Hyperbolic TDE with current r |
| 18: | else if _bin.semi > 0 then |
| 19: | Trigger Binary TDE with current r |
| 20: | end if |
| 21: | else if r · v < 0 then ▷ Objects are approaching |
| 22: | Compute tp (time to reach the pericentre) using orbital |
| parameters: | |
| 23: | M ← mean anomaly |
| 24: | n ← mean motion |
| 25: | tp ← M/n |
| 26: | if tp < current time step then |
| 27: | if _bin.semi < 0 then |
| 28: | Trigger Hyperbolic TDE at tp |
| 29: | else |
| 30: | Trigger Binary TDE at tp |
| 31: | end if |
| 32: | else |
| 33: | Schedule future collision interrupt at tp |
| 34: | end if |
| 35: | end if |
| 36: | else if rcollision > rp then Check for merger |
| 37: | Compute current separation r |
| 38: | Compute current relative velocity v |
| 39: | Compute collision distance rcollision = p1.radius + p2.radius |
| 40: | if r < rcollision then |
| 41: | if _bin.semi < 0 then |
| 42: | Trigger Dynamic Merger with current r |
| 43: | else |
| 44: | Trigger Binary Merger with current r |
| 45: | end if |
| 46: | else if r · v < 0 then |
| 47: | Estimate tp as above |
| 48: | if tp < current time step then |
| 49: | if _bin.semi < 0 then |
| 50: | Trigger Dynamic Merger at tp |
| 51: | else |
| 52: | Trigger Binary Merger at tp |
| 53: | end if |
| 54: | else |
| 55: | Schedule future collision interrupt at tp |
| 56: | end if |
| 57: | end if |
| 58: | end if |
Summary of the BH micro-TDE production efficiency posterior distribution (η) for different cluster subsets.
Summary of the expected detection rate of BH micro-TDEs (Γ) for different instruments and peak luminosity models.
All Tables
Summary of the BH micro-TDE production efficiency posterior distribution (η) for different cluster subsets.
Summary of the expected detection rate of BH micro-TDEs (Γ) for different instruments and peak luminosity models.
All Figures
|
Fig. 1 Grid of SC models created in this work, adapted from Fig. 9 in Krumholz et al. (2019). Black dots refer to combinations of initial half-mass radius, rh; cluster mass, MSC; and initial density (at the half-mass radius), ρh (M⊙ pc−3), used to construct the SC simulations. Red triangles indicate to the observed YSCs (Krumholz et al. 2019). |
| In the text | |
|
Fig. 2 Properties of primordial binaries adopted in our simulations, shown for one representative cluster realisation with initial mass mSC ≈ 9.8 × 10⁴ M⊙ and initial half-mass radius rh ≈ 4 pc. Left panel: mass distribution of primary stars (m1) in binaries and single stars (msing). Both populations are sampled from a Kroupa IMF. Central panel: distribution of binary orbital eccentricities (ecc) as a function of period (log(P) in days). The red curve marks the exclusion boundary (Eq. (3) in Moe & Di Stefano 2017), to avoid Roche lobe filling binaries. Right panel: mass-dependent binary fraction ( fbin) in our realisation (blue points) compared to observational constraints from Moe & Di Stefano (2017). |
| In the text | |
|
Fig. 3 Distribution of penetration factor (rt/rp) and star masses (m∗ in M⊙) of BH micro-TDEs occurring during single encounters for Z = 0.0002 (top panel) and Z = 0.02 (bottom panel). The colour map shows the BH masses (mBH in M⊙). |
| In the text | |
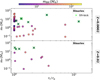 |
Fig. 4 Same as Fig. 3 but for the channel ‘binaries’. The green cross indicate SN-trigger events. |
| In the text | |
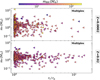 |
Fig. 5 Same as Fig. 4 but for the channel “multiples”. |
| In the text | |
|
Fig. 6 Micro-TDE production efficiencies of BHs, η, as a function of initial cluster density, ρh, for Z = 0.0002 (blue) and Z = 0.02 (red). The seven points correspond to cluster densities sampled from the cluster initial conditions (see Figure 1). The red points have been slightly shifted in ρh to improve visual clarity. Each point and its error bar represent the median and the 68% credible interval from the posterior distribution defined in Equation (3). |
| In the text | |
|
Fig. 7 Micro-TDE production efficiency of BHs for the two simulated metallicities. Circles indicate the efficiency considering the entire sample of events, while the other symbols represent contributions from different channels: diamonds are for single interactions, stars are for binaries, triangles are for multiples, and crosses are for micro-TDEs triggered by SN kicks (see Sect. 3.1). Each point and its error bar represent the median and the 68% credible interval from the posterior distribution defined in Eq. (3). |
| In the text | |
|
Fig. 8 Micro-TDE volumetric rates of BHs as a function of redshift (Eq. (4)). Solid lines show the median rates, while shaded bands indicate the 68% credible intervals obtained by sampling the posterior distributions of the production efficiency (Eq. (3)) and the fraction of star formation occurring in clusters (see Sect. 3.6). The red solid line corresponds to the total rate, while coloured lines represent the contributions from different formation channels: singles (orange, dash-dot-dot), binaries (magenta, dashed), multiples (blue, dash-dot), and SN-kicks (green, dotted), as detailed in Sect. 3.1. |
| In the text | |
|
Fig. 9 Cumulative micro-TDE rate of BHs as a function of the redshift (Eq. (6)). The colours indicate the fiducial (black), pessimistic (low density, red), and optimistic (high density, blue) model for the micro-TDE production efficiency (see Table B.1). The lines indicate the median, while the bands show the 68% (dark) and 99.7% (light) credible interval at a given redshift z. |
| In the text | |
|
Fig. 10 Same as Fig. 4 but for micro-TDE induced by NSs for the two channels: binaries (left panel, where green cross refer to SN-kick triggered events) and multiples (right panel). |
| In the text | |
|
Fig. 11 Distribution of BH micro-TDEs in the plane defined by the stellar-to-BH mass ratio (m∗/mBH) and the inverse of the penetration factor (β−1). The micro-TDEs occurring in our simulated YSCs are shown using the same axes and parameter space as Figure 1 of Kremer et al. (2022). Each channel (see Sect. 3.1) is marked with a different symbol: single (stars), binaries (circles), and multiples (triangles). Blue for Z = 0.0002 and red for Z = 0.02. The dashed black line indicates the boundary for which (rp = r∗), where r∗ is the star radius. |
| In the text | |
|
Fig. 12 Expected number of BH micro-TDE detections per year for three surveys (ZTF, ULTRASAT, and LSST) under different assumptions for the peak luminosity, based on the wind-reprocessed emission models of Kremer et al. (2023) (see main text for details). Symbols indicate the median of the posterior distribution computed using the full simulated sample, while thick coloured error bars show the 68% credible interval. Thin grey error bars represent the range of systematic uncertainties, bracketed by the 0.15th and 99.85th percentiles of the distributions obtained from simulations restricted to low-density and high-density clusters, respectively (see Sect. 3.5). Not visible symbols and bars indicate 0 detections. |
| In the text | |
|
Fig. 13 Expected frequency ( f ) and characteristic strain (hc) of the GW signal produced by micro-TDEs involving an MS star (mMS = 0.5 M⊙, hatched bands) and a WD (mWD = 1.4 M⊙, solid coloured bands), shown at three reference distances:∼1 Mpc (red), ∼16 Mpc (blue), and z = 1 (grey). The two grey arrows in the lower-left corner indicate the directions of increasing BH mass (mBH) and penetration factor (β ≡ rt/rp). These predictions are overlaid with the sensitivity curves of current and future GW detectors: LGWA (purple; Harms et al. 2021), LISA (sky blue; Amaro-Seoane et al. 2017), DECIGO (green; Sato et al. 2017), Kamioka Gravitational Wave Detector (KAGRA, gold; Abbott et al. 2021), the Einstein Telescope (ET, orange; Maggiore et al. 2020), the Advanced Laser Interferometer Gravitational-Wave Observatory (LIGO, violet; Abbott et al. 2017), and the Cosmic Explorer (CE, brown; Ng et al. 2021). |
| In the text | |
Current usage metrics show cumulative count of Article Views (full-text article views including HTML views, PDF and ePub downloads, according to the available data) and Abstracts Views on Vision4Press platform.
Data correspond to usage on the plateform after 2015. The current usage metrics is available 48-96 hours after online publication and is updated daily on week days.
Initial download of the metrics may take a while.