Fig. 12
Download original image
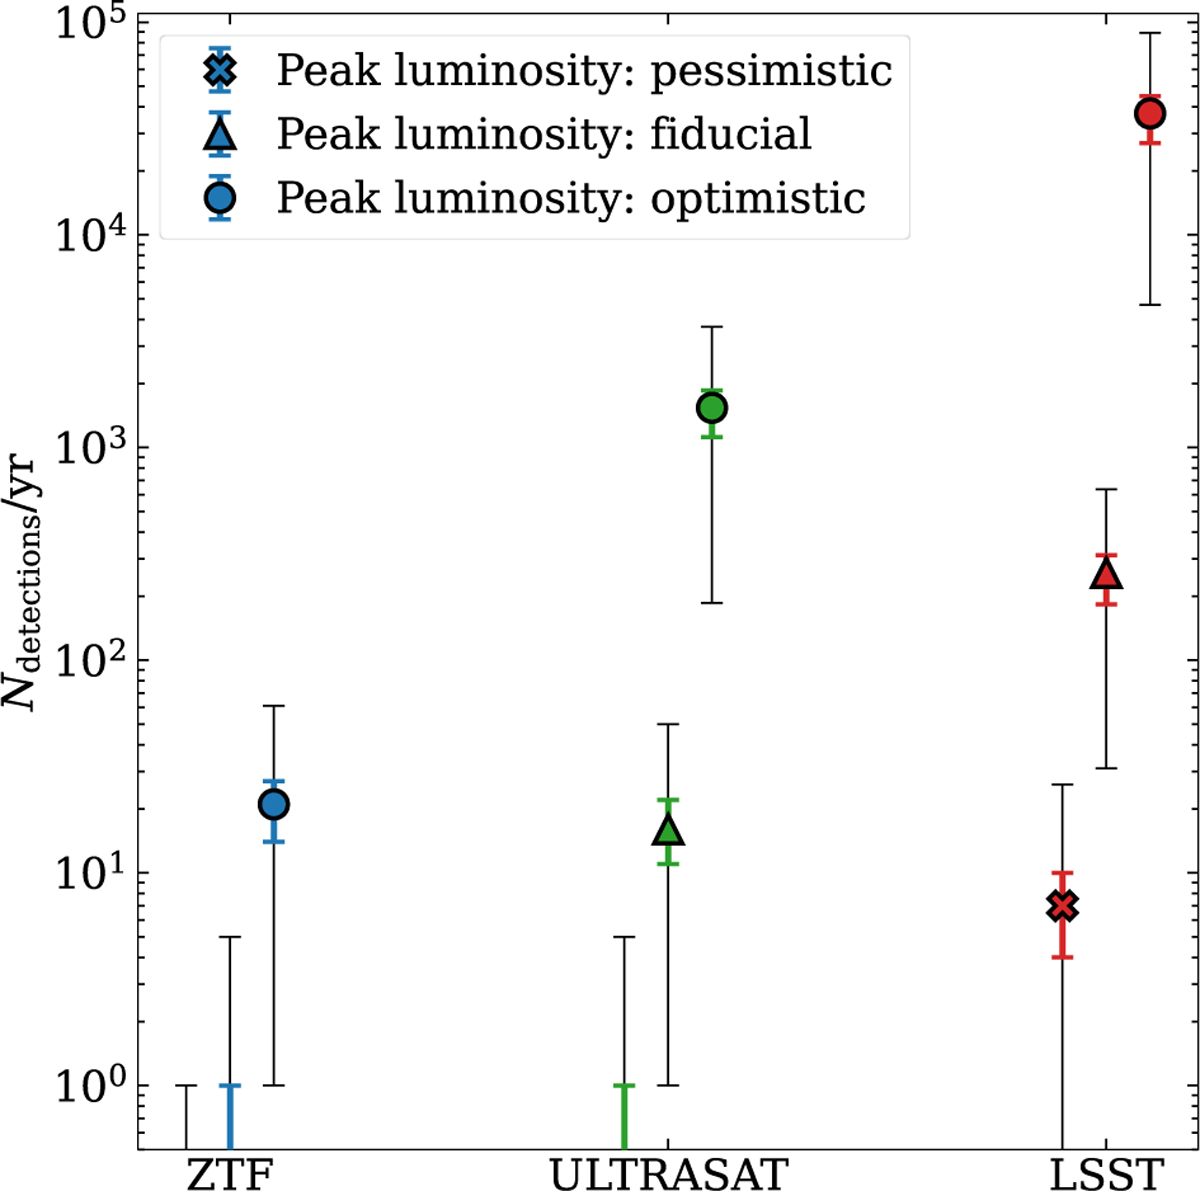
Expected number of BH micro-TDE detections per year for three surveys (ZTF, ULTRASAT, and LSST) under different assumptions for the peak luminosity, based on the wind-reprocessed emission models of Kremer et al. (2023) (see main text for details). Symbols indicate the median of the posterior distribution computed using the full simulated sample, while thick coloured error bars show the 68% credible interval. Thin grey error bars represent the range of systematic uncertainties, bracketed by the 0.15th and 99.85th percentiles of the distributions obtained from simulations restricted to low-density and high-density clusters, respectively (see Sect. 3.5). Not visible symbols and bars indicate 0 detections.
Current usage metrics show cumulative count of Article Views (full-text article views including HTML views, PDF and ePub downloads, according to the available data) and Abstracts Views on Vision4Press platform.
Data correspond to usage on the plateform after 2015. The current usage metrics is available 48-96 hours after online publication and is updated daily on week days.
Initial download of the metrics may take a while.