Fig. 6
Download original image
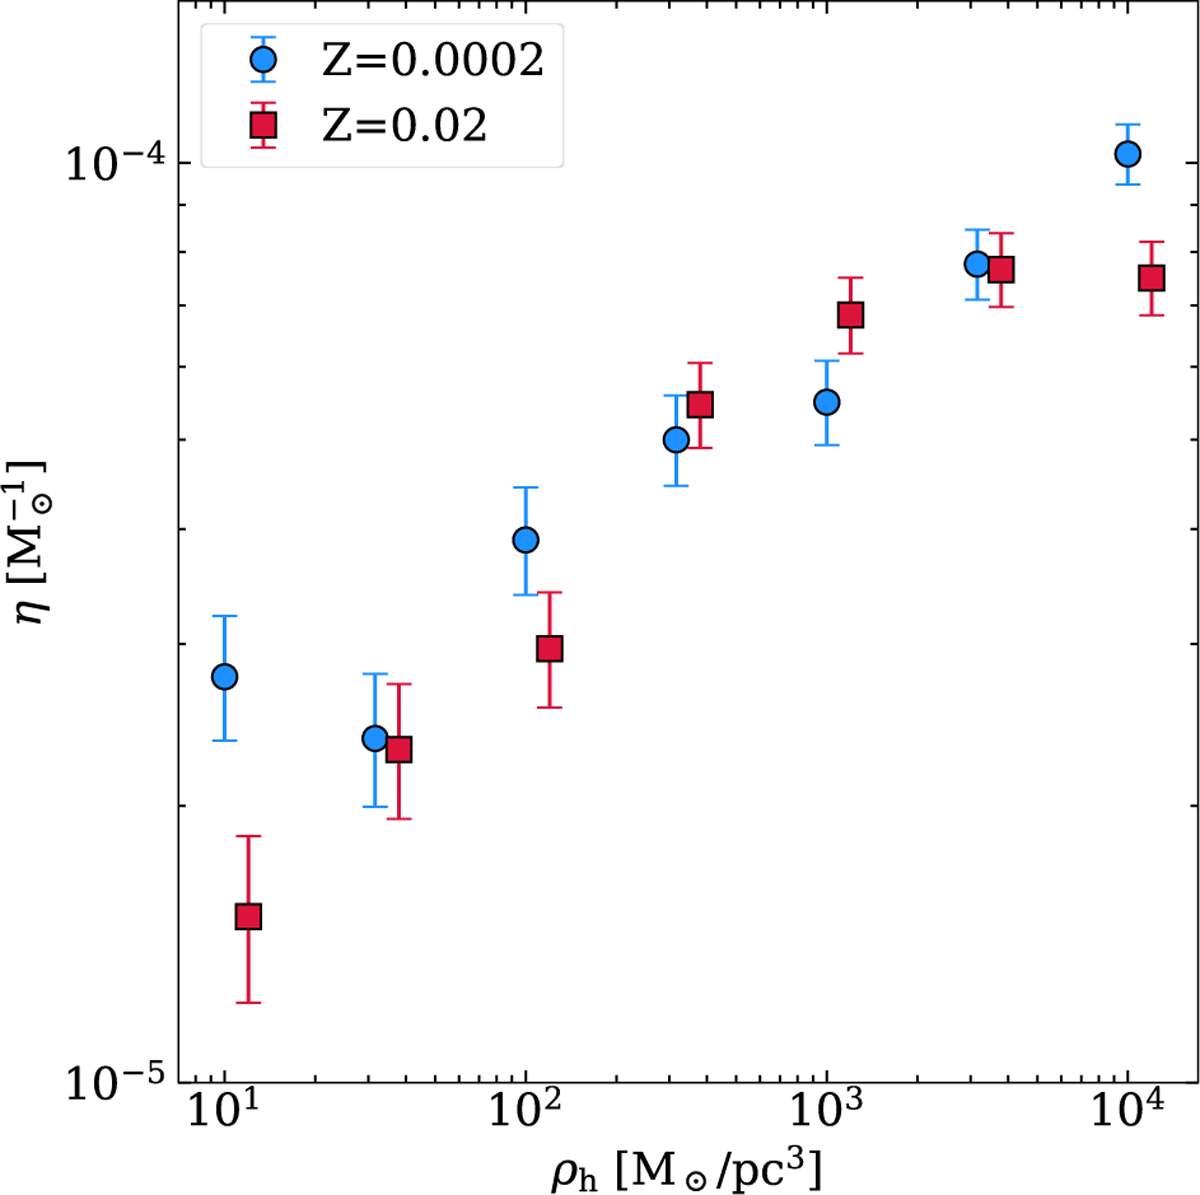
Micro-TDE production efficiencies of BHs, η, as a function of initial cluster density, ρh, for Z = 0.0002 (blue) and Z = 0.02 (red). The seven points correspond to cluster densities sampled from the cluster initial conditions (see Figure 1). The red points have been slightly shifted in ρh to improve visual clarity. Each point and its error bar represent the median and the 68% credible interval from the posterior distribution defined in Equation (3).
Current usage metrics show cumulative count of Article Views (full-text article views including HTML views, PDF and ePub downloads, according to the available data) and Abstracts Views on Vision4Press platform.
Data correspond to usage on the plateform after 2015. The current usage metrics is available 48-96 hours after online publication and is updated daily on week days.
Initial download of the metrics may take a while.