Fig. 7
Download original image
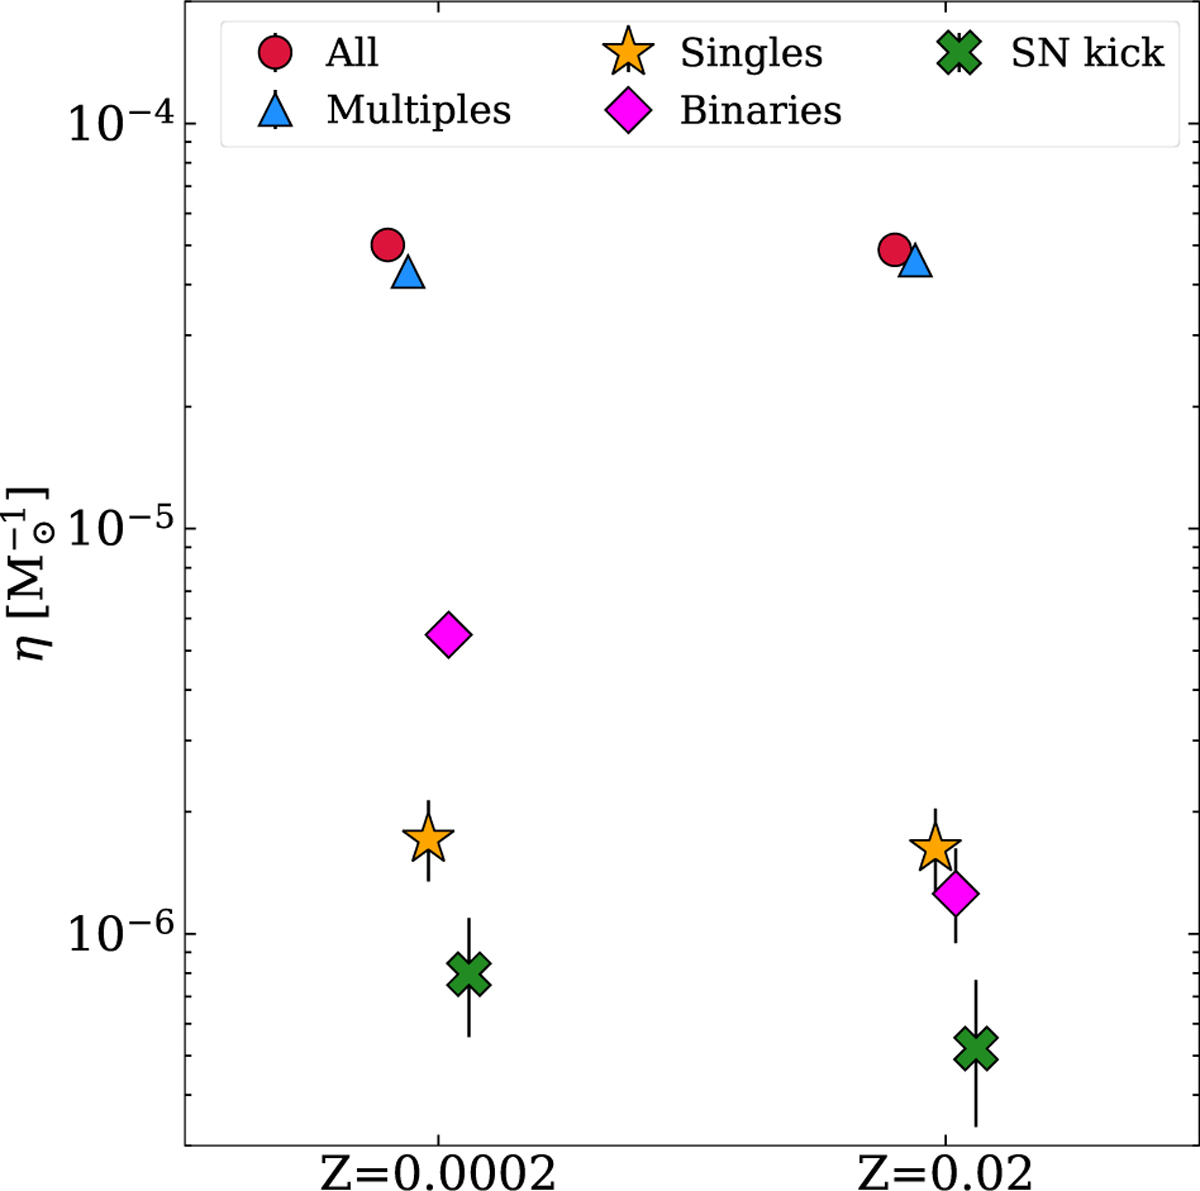
Micro-TDE production efficiency of BHs for the two simulated metallicities. Circles indicate the efficiency considering the entire sample of events, while the other symbols represent contributions from different channels: diamonds are for single interactions, stars are for binaries, triangles are for multiples, and crosses are for micro-TDEs triggered by SN kicks (see Sect. 3.1). Each point and its error bar represent the median and the 68% credible interval from the posterior distribution defined in Eq. (3).
Current usage metrics show cumulative count of Article Views (full-text article views including HTML views, PDF and ePub downloads, according to the available data) and Abstracts Views on Vision4Press platform.
Data correspond to usage on the plateform after 2015. The current usage metrics is available 48-96 hours after online publication and is updated daily on week days.
Initial download of the metrics may take a while.