Fig. 8
Download original image
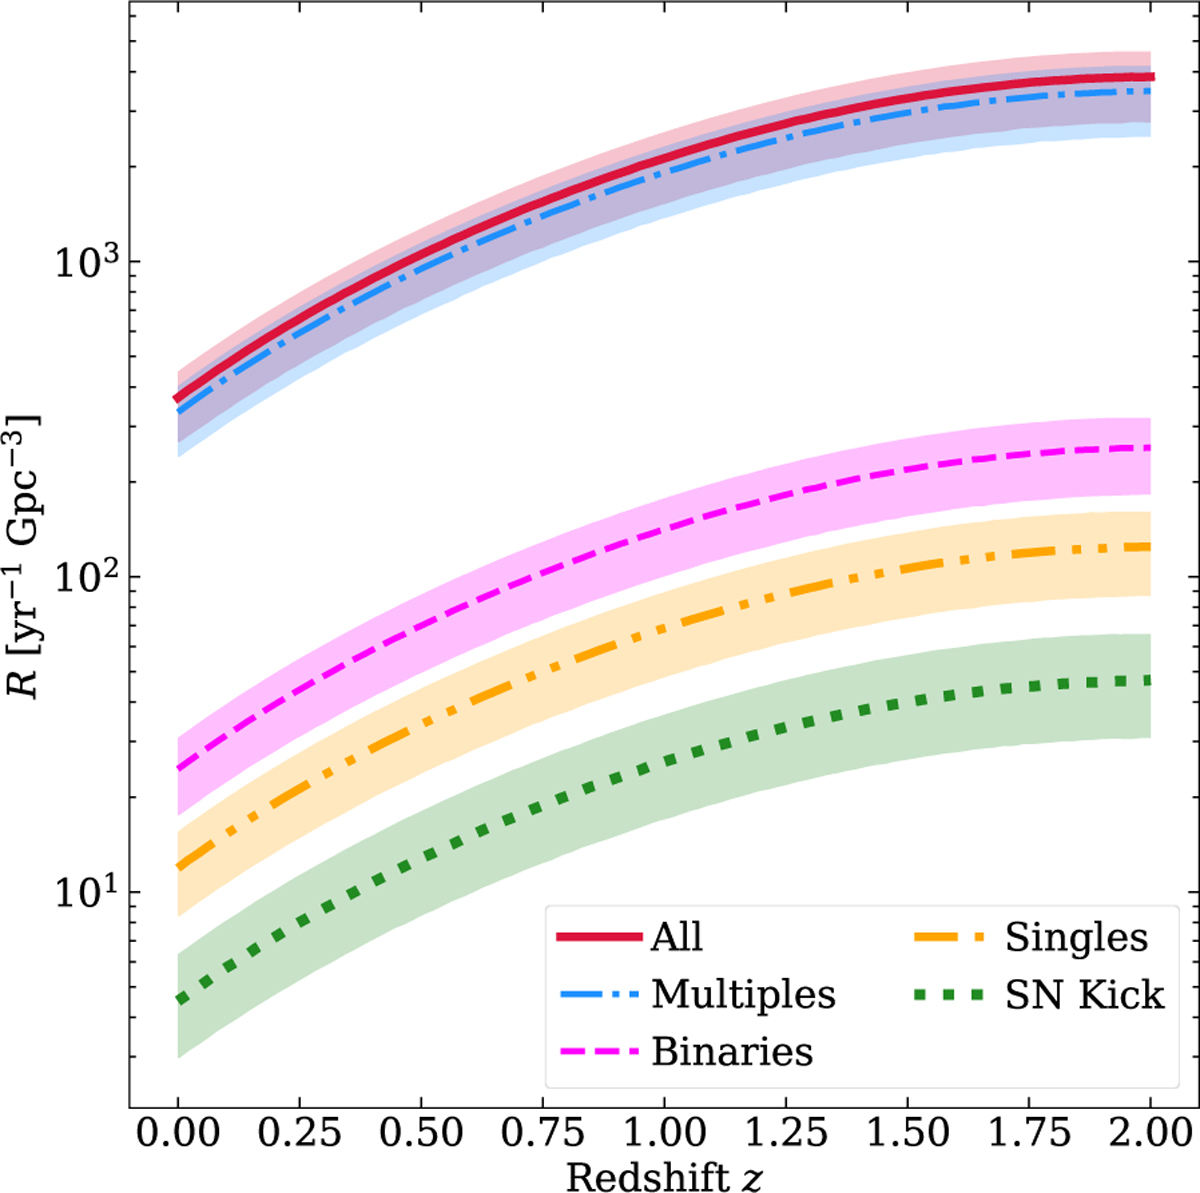
Micro-TDE volumetric rates of BHs as a function of redshift (Eq. (4)). Solid lines show the median rates, while shaded bands indicate the 68% credible intervals obtained by sampling the posterior distributions of the production efficiency (Eq. (3)) and the fraction of star formation occurring in clusters (see Sect. 3.6). The red solid line corresponds to the total rate, while coloured lines represent the contributions from different formation channels: singles (orange, dash-dot-dot), binaries (magenta, dashed), multiples (blue, dash-dot), and SN-kicks (green, dotted), as detailed in Sect. 3.1.
Current usage metrics show cumulative count of Article Views (full-text article views including HTML views, PDF and ePub downloads, according to the available data) and Abstracts Views on Vision4Press platform.
Data correspond to usage on the plateform after 2015. The current usage metrics is available 48-96 hours after online publication and is updated daily on week days.
Initial download of the metrics may take a while.