Fig. 9
Download original image
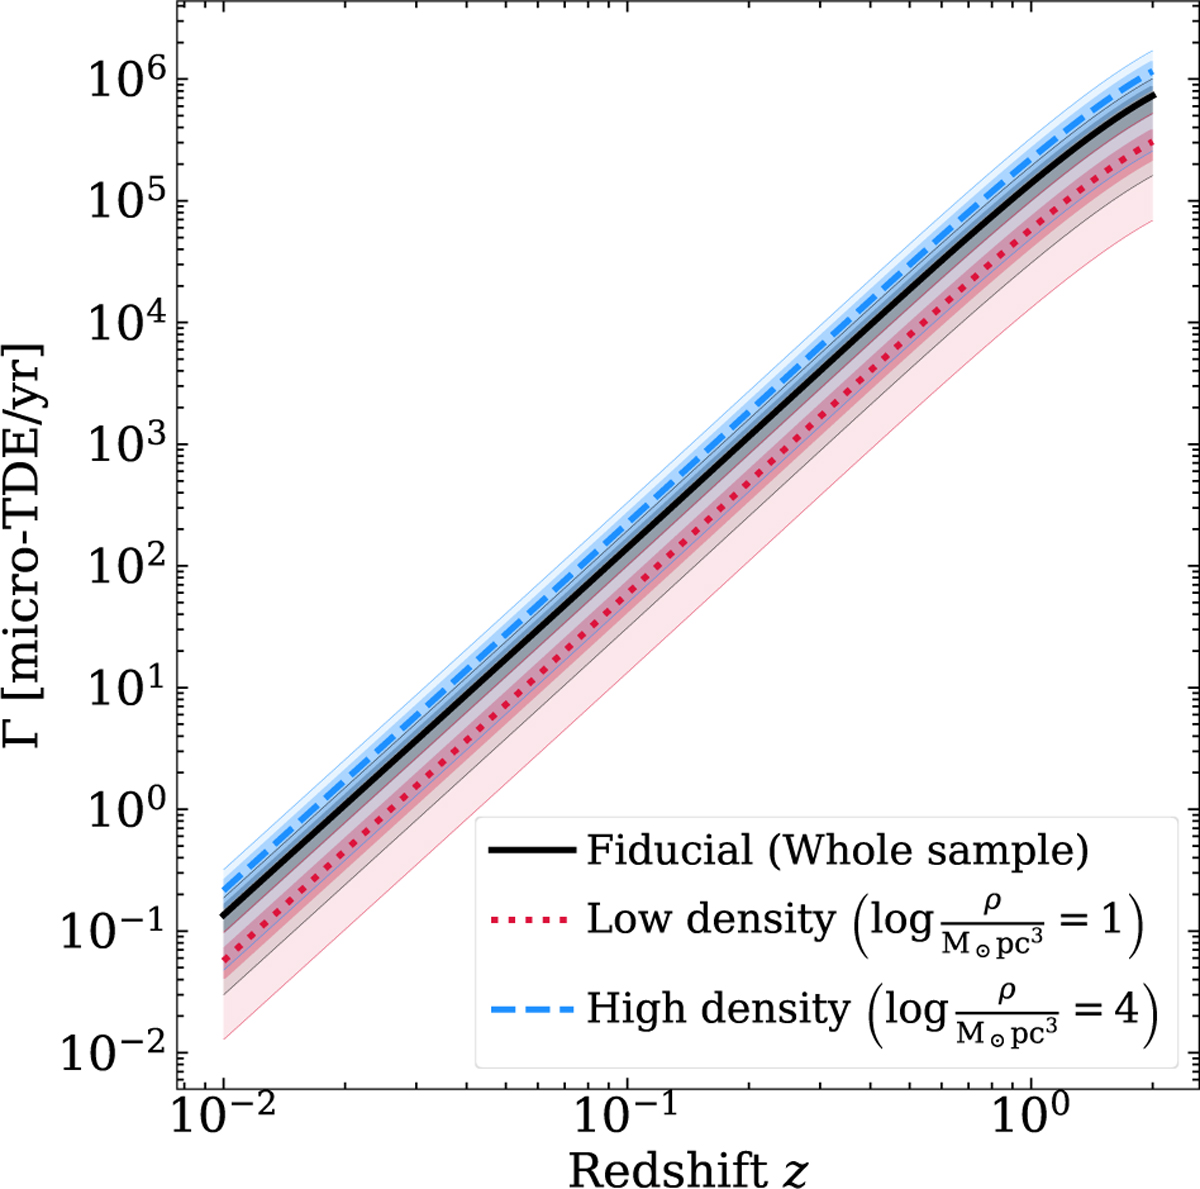
Cumulative micro-TDE rate of BHs as a function of the redshift (Eq. (6)). The colours indicate the fiducial (black), pessimistic (low density, red), and optimistic (high density, blue) model for the micro-TDE production efficiency (see Table B.1). The lines indicate the median, while the bands show the 68% (dark) and 99.7% (light) credible interval at a given redshift z.
Current usage metrics show cumulative count of Article Views (full-text article views including HTML views, PDF and ePub downloads, according to the available data) and Abstracts Views on Vision4Press platform.
Data correspond to usage on the plateform after 2015. The current usage metrics is available 48-96 hours after online publication and is updated daily on week days.
Initial download of the metrics may take a while.