Fig. 1
Download original image
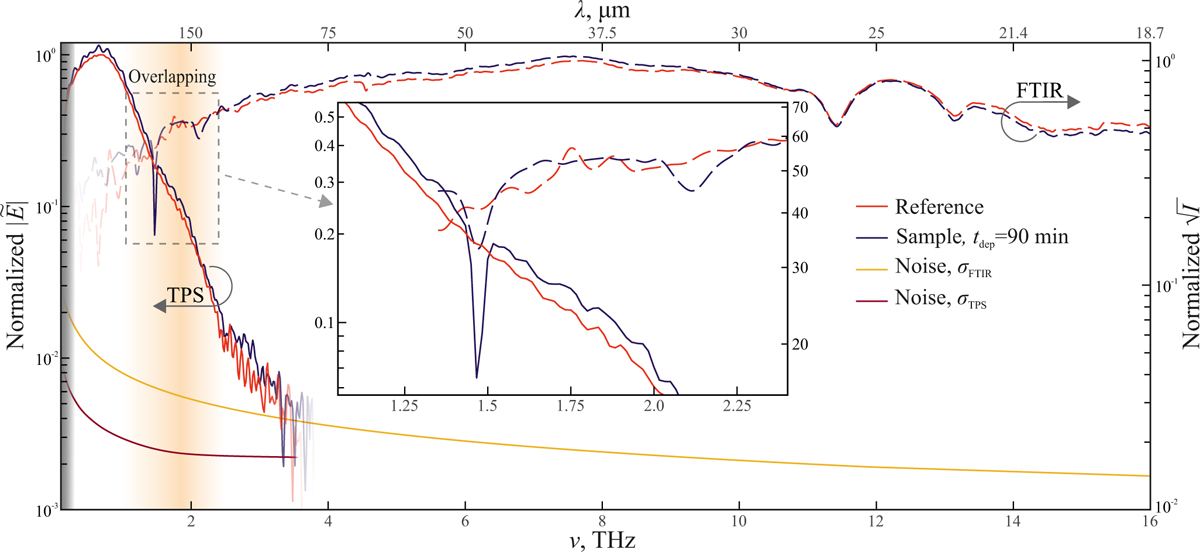
Reference and sample spectra of N2 ice, measured by the TPS (solid lines) and FTIR (dashed lines) spectrometers at specified deposition steps, tdep, and normalized by the maximum of the corresponding reference spectrum (for convenience). The low-frequency gray-shaded area shows the spectral range where distortions are expected owing to the THz beam diffraction at the sample aperture (Giuliano et al. 2019). The orange-shaded area near ≃2.0 THz (enlarged in the inset for clarity) indicates where the TPS and FTIR data overlap. The sensitivity of the TPS and FTIR measurements is characterized by the standard deviation of the corresponding instrumental noise, σTPS and σFTIR, as described by Gavdush et al. (2022).
Current usage metrics show cumulative count of Article Views (full-text article views including HTML views, PDF and ePub downloads, according to the available data) and Abstracts Views on Vision4Press platform.
Data correspond to usage on the plateform after 2015. The current usage metrics is available 48-96 hours after online publication and is updated daily on week days.
Initial download of the metrics may take a while.