| Issue |
A&A
Volume 707, March 2026
|
|
|---|---|---|
| Article Number | A344 | |
| Number of page(s) | 9 | |
| Section | Atomic, molecular, and nuclear data | |
| DOI | https://doi.org/10.1051/0004-6361/202556818 | |
| Published online | 20 March 2026 | |
Broadband spectroscopy of astrophysical ice analogues
IV. Optical constants of N2 ice in the terahertz and mid-infrared ranges
1
Max-Planck-Institut für Extraterrestrische Physik,
Gießenbachstraße 1,
Garching
85748,
Germany
2
Aix Marseille Univ, CNRS, CNES, LAM,
Marseille,
France
3
Prokhorov General Physics Institute of the Russian Academy of Sciences,
119991
Moscow,
Russia
4
Institute for Theoretical Chemistry, University of Stuttgart,
Pfaffenwaldring 55,
Stuttgart,
Germany
5
Department of Engineering, University of Perugia,
Via Duranti 93,
06125
Perugia,
Italy
6
Federal Institute of Education, Science and Technology of Rio de Janeiro (IFRJ), Nilópolis Campus,
Rio de Janeiro,
Brazil
★★ Corresponding author: This email address is being protected from spambots. You need JavaScript enabled to view it.
Received:
11
August
2025
Accepted:
29
December
2025
Abstract
Context. Understanding the optical properties of astrophysical ices is crucial for modeling dust continuum emission and radiative transfer in dense, cold interstellar environments. Molecular nitrogen, a primary carrier of N in protoplanetary disks, plays a key role in the formation of nitrogen-bearing species. However, the lack of direct measurements of the terahertz (THz) to infrared (IR) optical constants of N2 ice introduces uncertainties in radiative transfer models, snow-line locations, and disk mass estimates.
Aims. We present direct measurements and analysis of the optical properties of N2 ice across a broad THz–IR spectral range by combining THz pulsed spectroscopy (TPS) and Fourier-transform IR (FTIR) spectroscopy. The observed optically active THz vibrational modes of N2 ice are supported by density functional theory (DFT) calculations. The consistency of our measurements and calculations with datasets from the literature is also assessed.
Methods. N2 ice was grown at cryogenic temperatures via gas-phase deposition onto a cold silicon window. The optical properties of the ice samples were quantified using our earlier-reported method: it involves the direct reconstruction of the THz complex refractive index from the TPS data, combined with the derivation of the IR response from the FTIR data using the Kramers-Kronig relations. The N2 ice response was parameterized using the Lorentz model of complex dielectric permittivity, which was verified with our DFT calculations and compared with the literature data.
Results. The complex refractive index of N2 ice is quantified in the frequency range v = 0.3–16 THz (the wavelength range λ = 1 mm–18.75 μm), and was compared with the DFT results as well as with the available literature data. The observed resonant absorption peaks at νL = 1.47 and 2.13 THz; the damping constants of γL = 0.03 and 0.22 THz, respectively, are attributed to the well-known optically active phonons of the α-N2 crystal.
Conclusions. We provide a complete set of THz–IR optical constants for N2 ice by combining TPS and FTIR spectroscopy. Our results have implications for future observational and modeling studies of protoplanetary disk evolution and planet formation.
Key words: astrochemistry / methods: laboratory: solid state / techniques: spectroscopic / ISM: molecules
Marie Skłodowska-Curie Actions Individual Fellow at Leiden Observatory, Leiden University, Niels Bohrweg 2, 2333 CA Leiden, The Netherlands.
Present address: Aarhus Institute of Advanced Studies (AIAS), Aarhus University, Høegh-Guldbergs Gade 6B, 8000 Aarhus C, Denmark; Center for Interstellar Catalysis, Department of Physics and Astronomy, Aarhus University, 1520-337 Ny Munkegade 120, 8000 Aarhus C, Denmark.
© The Authors 2026
 Open Access article, published by EDP Sciences, under the terms of the Creative Commons Attribution License (https://creativecommons.org/licenses/by/4.0), which permits unrestricted use, distribution, and reproduction in any medium, provided the original work is properly cited.
This article is published in open access under the Subscribe to Open model.
Open Access funding provided by Max Planck Society.
1 Introduction
The distribution and abundance of ice components in protoplanetary disks are crucial for shaping the properties of emerging planetary systems. Ices influence both the growth and the inward migration of dust grains – the fundamental building blocks of planets – while also dictating the reservoir of key volatile elements (Gundlach & Blum 2015; Drążkowska & Alibert 2017; Sturm et al. 2023). The ice composition plays an important role in the thermodynamics and mass transfer in a disk, thus affecting the snow lines’ location and the efficiency of planetesimal formation (Öberg et al. 2011; Arabhavi et al. 2022; Gavino et al. 2023). Measurements and analysis of dust and ice opacities are powerful tools for better constraining the physical and chemical properties of disks. While the underlying optical constants are known, observations of dust continuum emission and the self-consistent modeling of dust opacity provide refined estimates of the disk mass, composition, and snow lines, as compared to those coming from models based on the baregrain assumption (Arabhavi et al. 2022). The key to realizing these improvements is obtaining reliable optical constants of ices across the wide terahertz (THz) to infrared (IR) range relevant to protoplanetary disks.
Traditionally, ice optical constants have been derived using Fourier-transform IR (FTIR) spectroscopy, which yields only the amplitude transmission spectra; FTIR spectroscopy is commonly used along with the Kramers-Kronig relations to retrieve the phase for the complete characterization of an ice sample (Bergren et al. 1978; Hagen & Tielens 1981; Hudgins et al. 1993). Although this approach has led to invaluable catalogs of optical data, reliance on the underlying assumptions and mathematical derivations can introduce measurement uncertainties. To mitigate this difficulty, the THz pulsed spectroscopy (TPS) technique was applied by Giuliano et al. (2019) to measure the THz response of ices with no need for the Kramers-Kronig transform. TPS offers a favorable opportunity to detect the THz waveform transmitted through an analyte, the Fourier transform, which provides the spectral amplitude and phase. This makes it possible to directly retrieve the THz complex refractive index in a broad spectral range. It was shown by Gavdush et al. (2022) that the spectral phase of TPS can be used to calibrate that of FTIR data and, thus, to eliminate the Kramers-Kronig transform uncertainty, facilitating the broadband characterization of laboratory ices. Such a technique was then applied to broadband optical spectra to comprehensively analyze the THz–IR optical constants of CO and CO2 ices (Gavdush et al. 2022), as well as their scattering properties and porosity (Gavdush et al. 2025).
The next goal of our broadband spectroscopic measurements is the characterization of N2 ice. Of all the volatiles, molecular nitrogen is recognized as the primary nitrogen carrier in protoplanetary disks. It plays a crucial role in the formation of abundant N-bearing gas-phase species such as NH3 and N2H+ (e.g., Hily-Blant et al. 2010). In our Solar System, the presence of N2 ice has been confirmed in dwarf planets Pluto and Eris and Neptune’s largest moon Triton (Tegler et al. 2010, 2012).
Because N2 has no strong dipole moment, and thus lacks strong optically active vibrational modes, it is notoriously difficult to observe directly. Estimates of its abundance depend on indirect tracers, such as N2H+, the CN/HCN ratio, and various nitriles (Qi et al. 2019; van ’t Hoff et al. 2017). These proxies provide valuable constraints on the N2 distribution, especially in cold outer disks where N2 is expected to freeze out once temperatures drop below 20–25 K (Minissale et al. 2022). However, indirect methods inevitably introduce observational and chemical modeling uncertainties, highlighting the need for complementary approaches, particularly for the solid phase. Understanding the ice reservoir of N2 is important not only to constrain its overall abundance but also to elucidate its role in the formation of N-bearing species on grains in the densest disk regions (Walsh et al. 2014).
In this study, N2 ice was grown at cryogenic temperatures and measured using TPS and FTIR techniques. The optical properties of N2 ice were retrieved in a broad spectral range spanning the frequencies (ν) 0.3–16 THz, or the wavelengths (λ) ≃ 1 mm–18.75 μm. The observed optically active vibrational modes are attributed to the quadrupole moments of a molecule in a crystalline lattice, parametrized by the Lorentz model; this is supported by density functional theory (DFT) calculations and available literature data. The obtained data regarding the THz–IR optical properties of N2 ice would be useful for modeling nitrogen freeze-out and chemistry in protoplanetary disks. Our findings can be used to calculate how the opacities of dust grains change when they are covered in ice mantles, particularly in spectroscopic regions where the ices’ resonance features are present. This information aids in the interpretation of dust continuum emission, including variations expected between dense and diffuse regions, where the fraction of ice-coated grains differs.
2 Methods
2.1 The experimental setup
The experimental studies were conducted at the CASICE laboratory developed at the Center for Astrochemical Studies at the Max Planck Institute for Extraterrestrial Physics (Garching, Germany). Data obtained with the TPS (Giuliano et al. 2019) and FTIR (Müller et al. 2018) spectrometers were combined to derive the broadband optical constants of N2 ice.
In the original design of our laboratory, the same vacuum chamber can be coupled to both the TPS and the FTIR spectrometers. A motorized translation stage moves the chamber between the sample compartments of the two spectrometers and adjusts the position relative to the beam. This ensures that the ice samples analyzed with the two instruments have reproducible properties for given deposition conditions. Therefore, the spectroscopic data recorded in the THz and IR ranges can be directly merged for the calculation of the broadband complex refractive index of an ice. However, the measurements have not been performed on an identical set of ice samples.
A scheme of the vacuum chamber, TPS and FTIR arrangements are detailed in Gavdush et al. (2022). The 15 cm diameter vacuum chamber is equipped with a high-power closed-cycle cryocooler (Advanced Research Systems), which cools down the sample holder to a temperature of 5 K in normal operation mode. To provide homogeneous ice deposition (over the optical aperture of a substrate) for the experiments, in this work, the radiation shield was removed from the sample holder, reaching a minimum achievable temperature of 11 K. A base pressure of ≃10−7 mbar is set when the system is cold via a pumping station composed of a turbomolecular pump combined with a backing rotary pump.
The substrate is placed in the middle of the vacuum chamber and the optical windows of the chamber are made of the high-resistivity float-zone silicon (HRFZ-Si) with the high refractive index of nSi ≈ 3.4, negligible dispersion, and small absorption in the desired THz–IR range. It is worth noting that the broadband dielectric response of this THz–IR optical material is almost independent of temperature.
The TPS spectrometer (BATOP TDS-1008) features a broad spectral range of 0.05–3.5 THz, with a maximum at ≈1.0 THz and a spectral resolution as high as ≈0.03 THz. In this TPS system, a pair of photoconductive antennas are pumped and probed by a femtosecond fiber laser (TOPTICA), serving as an emitter and a detector of THz pulses. A customized sample compartment allocates the cryocooler, while the TPS housing is kept under cold nitrogen gas purging, aimed at suppressing an impact of atmospheric water along the beam path on the measured THz data.
A Bruker IFS 125 HR FTIR spectrometer was used to record the transmission IR spectra of ice, with a resolution as high as ≃1 cm−1 (≃0.03 THz). A Mylar multilayer beam splitter, a far-IR Hg source, and a far-IR DTGS (Deuterated Triglycine Sulfate) detector were selected to work in the far-IR and mid-IR ranges. A customized flange accommodates the cryocooler in the spectrometer sample compartment, which is kept under vacuum.
2.2 The experimental protocol
The ice samples for the TPS and FTIR measurements were grown under the same experimental conditions. Following the experimental procedure by Giuliano et al. (2019), the ice layers are formed by the condensation from the gas phase through a 6-mm-diameter stainless steel pipe placed at ≃7 cm from the substrate to ensure uniform deposition on both sides. A metering valve regulated the N2 flux. To minimize H2O and CO2 contamination in the gas flow entering the vacuum chamber, the last part of the gas line includes a trap, made of a copper coil and immersed in liquid nitrogen. Such a trap reduces the total gas flux and, thus, increases by ≃3 times the required deposition time to reach the same ice thickness as reported in our earlier studies (Giuliano et al. 2019; Gavdush et al. 2022; Gavdush et al. 2025).
A thickness on the order of a fraction of a millimeter is required to obtain a reliable reconstruction of the THz–IR optical constants, so the chosen deposition rate must be fast enough to grow thick ice in a reasonable experimental time. To achieve this condition, the pressure was maintained at ≈10−4 mbar, while each deposition step was set to 9 min, minimizing heating of the HRFZ-Si substrate due to gas condensation. The total deposition time was 90 min, resulting in an overall ice thickness of approximately 1.72 mm. The ice layers on the front and back sides of the substrate reached thicknesses of about 1.028 and 0.689 mm, respectively. The substrate temperature was maintained at 11 K prior to deposition and increased slightly to 12 K during each deposition cycle. Between consecutive steps, the system was allowed to equilibrate until the substrate temperature returned to 11 K.
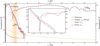 |
Fig. 1 Reference and sample spectra of N2 ice, measured by the TPS (solid lines) and FTIR (dashed lines) spectrometers at specified deposition steps, tdep, and normalized by the maximum of the corresponding reference spectrum (for convenience). The low-frequency gray-shaded area shows the spectral range where distortions are expected owing to the THz beam diffraction at the sample aperture (Giuliano et al. 2019). The orange-shaded area near ≃2.0 THz (enlarged in the inset for clarity) indicates where the TPS and FTIR data overlap. The sensitivity of the TPS and FTIR measurements is characterized by the standard deviation of the corresponding instrumental noise, σTPS and σFTIR, as described by Gavdush et al. (2022). |
2.3 TPS and FTIR data processing
For both the TPS and FTIR measurements, reference spectra of the bare substrate were recorded before the start of the deposition process. The sample signals were measured every second deposition step after 18 min. The Tukey (Tukey et al. 1986) and fourth-order Blackman-Harris (Harris 1978) apodization windows were applied for preprocessing of the TPS waveforms and FTIR interferograms, respectively. For the TPS data, the application of the Fourier transform results in the frequency-domain complex amplitude ![Mathematical equation: $\[\widetilde{E}(\nu)\]$](/articles/aa/full_html/2026/03/aa56818-25/aa56818-25-eq1.png) , with both the amplitude and phase information, which makes possible the direct reconstruction of the THz complex dielectric permittivity of an analyte (Giuliano et al. 2019). In turn, FTIR gives the power spectrum
, with both the amplitude and phase information, which makes possible the direct reconstruction of the THz complex dielectric permittivity of an analyte (Giuliano et al. 2019). In turn, FTIR gives the power spectrum ![Mathematical equation: $\[I(\nu) \propto|\widetilde{E}(\nu)|^{2}\]$](/articles/aa/full_html/2026/03/aa56818-25/aa56818-25-eq2.png) with only the amplitude information (Griffiths & de Haseth 1986).
with only the amplitude information (Griffiths & de Haseth 1986).
From the reference (bare substrate) and sample measurements, we defined the experimental transmission coefficients of the ice films. For TPS, where the complex electric-field spectrum ![Mathematical equation: $\[\widetilde{E}(\nu)\]$](/articles/aa/full_html/2026/03/aa56818-25/aa56818-25-eq3.png) is available, the complex transmission amplitude reads
is available, the complex transmission amplitude reads
![Mathematical equation: $\[\widetilde{T}_{\text {exp}, \text {TPS}}(\nu)=\frac{\widetilde{E}_{\text {sample}}(\nu)}{\widetilde{E}_{\text {reference}}(\nu)},\]$](/articles/aa/full_html/2026/03/aa56818-25/aa56818-25-eq4.png) (1)
(1)
whereas for FTIR, which provides intensities, we report the amplitude of the transmission as
![Mathematical equation: $\[\left|\widetilde{T}_{\text {exp,FTIR}}(\nu)\right|=\sqrt{\frac{I_{\text {sample}}(\nu)}{I_{\text {reference}}(\nu)}}.\]$](/articles/aa/full_html/2026/03/aa56818-25/aa56818-25-eq5.png) (2)
(2)
These definitions link the complex transmission of Fig. 2 to the E– and I–spectra in Fig. 1. In the next step, the TPS and FTIR datasets are merged by (i) reconstructing the FTIR phase via the Kramers–Kronig transform and (ii) matching amplitudes and phases to the TPS reference, following the procedure detailed in Gavdush et al. (2022).
In Fig. 1, the reference and sample spectra are acquired by TPS and FTIR systems for the N2-ice samples of different thicknesses. The shaded spectral range of the TPS and FTIR data overlapping near ≃2.0 THz is broad enough to make merging the spectral data possible. We have no absorption lines except at 1.5 and 2.13 THz. For both the TPS and FTIR systems, in Fig. 1, the spectral noise levels are estimated in the form of frequency-dependent standard deviations σTPS (ν) and σFTIR (ν), to highlight the variability of the reference spectra as detailed by Gavdush et al. (2022). Figures 2a and b illustrates the merging of the TPS and FTIR data for the N2 ice after a 54-min-long deposition. In the overlapping range, the measured TPS (green markers) and FTIR (blue markers) data are close. The weighted superposition of the transmission spectra in the overlapping range is used to calculate the broadband transmission amplitude |![Mathematical equation: $\[\widetilde{T}(\nu)\]$](/articles/aa/full_html/2026/03/aa56818-25/aa56818-25-eq6.png) |, while the spectral signal-to-noise ratios of our spectrometers ensure a smooth transition from the lower to higher frequencies as shown by Gavdush et al. (2022). In Fig. 2c, the missing IR phase is retrieved from the FTIR data using the Kramers-Kronig transform (Martin 1967; Lucas et al. 2012), while a knowledge of the low-frequency TPS phase enables the Kramers-Kronig transform uncertainty to be mitigated (Gavdush et al. 2022).
|, while the spectral signal-to-noise ratios of our spectrometers ensure a smooth transition from the lower to higher frequencies as shown by Gavdush et al. (2022). In Fig. 2c, the missing IR phase is retrieved from the FTIR data using the Kramers-Kronig transform (Martin 1967; Lucas et al. 2012), while a knowledge of the low-frequency TPS phase enables the Kramers-Kronig transform uncertainty to be mitigated (Gavdush et al. 2022).
In this way, broadband complex transmission spectra, ![Mathematical equation: $\[\widetilde{T}(\nu)\]$](/articles/aa/full_html/2026/03/aa56818-25/aa56818-25-eq8.png) , were obtained from the experiments and used to retrieve both the thicknesses of N2 ice samples and their complex refractive index
, were obtained from the experiments and used to retrieve both the thicknesses of N2 ice samples and their complex refractive index ![Mathematical equation: $\[\widetilde{n}=n-i \alpha c_{0} /(2 \pi v) \equiv \sqrt{\widetilde{\varepsilon}}\]$](/articles/aa/full_html/2026/03/aa56818-25/aa56818-25-eq9.png) in the frequency range of 0.3–16.0 THz, where n is a real refractive index, α is an absorption coefficient (by field)1, c0 = 3 × 10⁸ m/s is the speed of light in vacuum, while
in the frequency range of 0.3–16.0 THz, where n is a real refractive index, α is an absorption coefficient (by field)1, c0 = 3 × 10⁸ m/s is the speed of light in vacuum, while ![Mathematical equation: $\[\widetilde{\varepsilon}=\varepsilon^{\prime}-i \varepsilon^{\prime \prime}\]$](/articles/aa/full_html/2026/03/aa56818-25/aa56818-25-eq10.png) is the complex dielectric permittivity. For this, we used the earlier-reported approach (Giuliano et al. 2019; Gavdush et al. 2022) that minimizes the error functional – i.e., a discrepancy between the experimental complex transmission spectrum
is the complex dielectric permittivity. For this, we used the earlier-reported approach (Giuliano et al. 2019; Gavdush et al. 2022) that minimizes the error functional – i.e., a discrepancy between the experimental complex transmission spectrum ![Mathematical equation: $\[\widetilde{T}(\nu)\]$](/articles/aa/full_html/2026/03/aa56818-25/aa56818-25-eq11.png) and its theoretical model, which accounts for all key features of the radiation-sample interactions: reflections at interfaces, absorption and phase delay in bulk, standing waves in layers, finite coherence length, and signal apodization. Moreover, determining the position of satellite pulses from the TPS waveforms is used to find the thicknesses of the ice layers (Giuliano et al. 2019).
and its theoretical model, which accounts for all key features of the radiation-sample interactions: reflections at interfaces, absorption and phase delay in bulk, standing waves in layers, finite coherence length, and signal apodization. Moreover, determining the position of satellite pulses from the TPS waveforms is used to find the thicknesses of the ice layers (Giuliano et al. 2019).
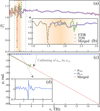 |
Fig. 2 Merging of the TPS and FTIR data for N2 ice after the 54-minute-long deposition. (a) Amplitude of the complex transmission coefficient | |
![Mathematical equation: $\[\widetilde{T}(\nu)\]$](/articles/aa/full_html/2026/03/aa56818-25/aa56818-25-eq7.png)
2.4 Theoretical analysis
2.4.1 Analytical model of complex dielectric permittivity
Resonant absorption peaks observed in the broadband dielectric spectra of the N2 ice were modeled by a superposition of the Lorentz kernels:
![Mathematical equation: $\[\widetilde{\varepsilon}(\nu)=\varepsilon_{\infty}+\sum_{j=1}^2 \frac{\Delta \varepsilon_j \nu_{\mathrm{L}, j}^2}{\nu_{\mathrm{L}, j}^2-\nu^2+i \nu \gamma_{\mathrm{L}, j}},\]$](/articles/aa/full_html/2026/03/aa56818-25/aa56818-25-eq12.png) (3)
(3)
where Δεj, νL,j, and γL,j are the amplitude, resonant frequency, and damping constant of the jth Lorentz term, while ε∞ is the constant dielectric permittivity at higher frequencies. Parameters νL,j and γL,j indicate the spectral position and width of each Lorentz oscillator, while Δεj is responsible for its contribution to the total dielectric response. It is worth noting that this model is physically rigorous since it satisfies the sum rule (Martin 1967; Komandin et al. 2022) and the Kramers-Kronig relations (Martin 1967; Lucas et al. 2012). This favorably distinguishes the model defined by Eq. (3) from a series of Gaussian bands often used to analyze the astrophysical ice absorption properties (Boogert et al. 2015).
The first approximations for the model parameters are estimated from the reconstructed dielectric response, including positions and width of the absorption peak, where the magnitude of the peak can be estimated from the real dielectric permittivity. Owing to the convenience of presenting results via n(ν) and α(ν), this form was chosen for the measured data representation; if needed, this can be easily converted to ε′ and ε″, as detailed above.
2.4.2 DFT calculations of vibrational modes
To simulate the far-IR spectra, the α-phase of the N2 crystal was considered, as expected in our experimental conditions (Wyckoff 1963). It features the primitive cubic crystalline lattice, characterized by four molecules per unit cell of the volume of 179.79 Å3 and the period of 5.64 Å. Such a unit cell was repeated 2 × 2 × 2 times, and the gas-phase cluster model was created by removing the N atoms at the boundaries. This allows us to model solid materials with high accuracy by using gas-phase codes, enabling the use of a higher-level theory.
To compute the IR spectra in the THz region (see Appendix A), we employed DFT implemented in the ORCA code (Neese et al. 2020). We used the B3LYP exchangecorrelation functional (Becke 1993; Lee et al. 1988) and a triple-zeta valence basis set with polarization functions Def2-TVZP (Weigend & Ahlrichs 2005). This method has been reported to reproduce experimental spectra in the THz region of solid-state species belonging to the 2 p series of the periodic table (Cutini & Ugliengo 2021; Kambara 2014; Wang & Wang 2012; Chen et al. 2004; Oppenheim et al. 2010; Dash et al. 2015). Dispersion correction was not taken into account (see Appendix A), as it causes a redshift of the vibrational modes.
Vibrational frequencies were computed using the harmonic approximation. We opted not to optimize the experimental structure (Wyckoff 1963), because the optimization leads to the larger interatomic distances and, thus, to significant changes in the absorption peak positions. The self-consistent field convergence was achieved when the relative energy change is lower than 10−14 The resolution of identity (RI-JONX method) approximation (Neese 2003) was applied to reduce the computational cost for the Coulomb integral only, but not for the Hartree-Fock exchange, in order to ensure the highest possible accuracy at a lower computational cost, using an auto-generated auxiliary basis set (Stoychev et al. 2017) by ORCA.
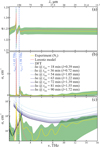 |
Fig. 3 Broadband THz–IR optical properties of the N2 ice, deduced from measurements of samples of different thicknesses (l). The solid yellow lines show the mean values, the green-shaded zones the ±1.5σ (87%) confidence intervals of the measurements, and the solid red lines the complex dielectric permittivity model defined by Eq. (3) and Table 1. (a) Refractive index (n). (b) and (c) Absorption coefficient (α; by field) in the linear and logarithmic scales, respectively. In (c), the solid blue lines define the 3σ detection limits for the absorption δα, calculated for the different ice thicknesses (l; measured with the ~0.01 mm uncertainty). In (a)–(c), the vertical dashed blue lines define the frequencies of the α-N2 vibrational modes predicted by the DFT method. |
3 Results
In Fig. 3, the estimated broadband dielectric response of N2 ice deposited at 11 K is shown as the refractive index (n) and absorption coefficient (α) by field. The average values and ±1.5σ (or 87%) confidence intervals were calculated from the ensemble of measurements at the different deposition times in the 18–90 min range with the 18 min step. As shown by Gavdush et al. (2022), the sensitivity of our spectrometers significantly impacts the reconstruction accuracy, especially in the case of a low-absorbing species. Therefore, in Fig. 3c, approximations for the detection limit are calculated from the TPS and FTIR noises (σTPS and σFTIR, shown in Fig. 1) as a function of the deposition time tdep (or the total sample thickness l) as detailed in (Gavdush et al. 2022). From these estimates, one notices that two absorption peaks at lower frequencies are above the detection limit, while all the IR background absorption is below. Thus, we further analyzed only these two physically reasonable absorption peaks while neglecting the background that is more likely attributed to noise.
In Fig. 3, the complex dielectric permittivity model defined by Eq. (3) is estimated and overlapped with the experimental curves, while the resultant model parameters are summarized in Table 1. The absorption peaks observed at 1.47 and 2.13 THz agree with the literature data on studies of the solid-state nitrogen – i.e., the molecular crystal, the THz–IR response of which depends on the crystalline structure (Ron & Schnepp 1967; Anderson & Leroi 1966a; Louis & Schnepp 1969; Scott 1976; Savchenko et al. 2019).
As discussed in Sect. 2.4.2, the applied growth conditions presume that the N2 ice is in the α phase. In such a case, the factor group analysis predicts 24 normal modes for the Pa3 space group, among which only three are translational phonon modes Tu, including the single acoustic and two optically active Tu phonons. These modes were analyzed theoretically and studied experimentally via the FTIR and neutron scattering techniques by several groups (e.g., Ron & Schnepp 1967; Anderson & Leroi 1966a; Louis & Schnepp 1969; Kjems & Dolling 1975). The two optical features and the associated absorption bands show some variations between different experiments. For instance, by comparing our results with those of Ron & Schnepp (1967), we obtain a ≈30% discrepancy for the ratio of the amplitude absorption values (0.35 in Ron & Schnepp 1967 versus 0.27 in the present study) and the ratio of the integrated absorption intensities (0.76 in Ron & Schnepp 1967 versus 1.11 in our work).
Broadening and some asymmetry of the 2.13 THz peak (as compared to the Lorentz model) might indicate anharmonicity effects, which can be explained by the dependence between the mode frequency and damping (Hardy & Karo 1982), or the morphological features of ice (porosity, disorder, and polycrystallinity). A somewhat monotonic increase in the N2-ice absorption at higher frequencies (>8.0 THz) is attributed to the scattering on heterogeneities of an analyte (such as pores, as reported by Gavdush et al. 2025). This effect indirectly evidences the imperfect ice structure but is still below the defined detection limit.
Our DFT calculations of the α-N2 vibrational modes depict two harmonic frequencies, representing the expected translational movements of N2 molecules and pointed out in Fig. 3. From Table 2, we also notice that these vibrational modes agree with both our and earlier-reported experiments, as well as the theoretical predictions based on the interatomic potentials (Zunger & Huler 1975). The discrepancies are quite small – at the level of a few inverse centimeters. They are in close agreement within the DFT accuracy (Banks et al. 2020). Our theoretical analysis not only reproduced the α-N2 translational modes, but also revealed some temperature dependence of the lattice structure and the resultant evolution of vibrational modes with temperature (see Appendix A). However, this aspect is beyond the scope of this article. Thereby, both the literature survey on the response of solid nitrogen and the DFT simulations justify the origin of the N2-ice vibrational modes observed in our THz–IR spectroscopic experiments.
Dielectric permittivity model parameters for N2 ice.
Optically active vibrational modes of α-N2 ice.
4 Discussion and conclusions
In this work we combined TPS and FTIR spectroscopy to study the THz–IR response of laboratory analogs of N2 astrophysical ice. The main results of our findings can be summarized as follows:
The optical properties of N2 ice deposited on the HRFZ-Si substrate at a temperature of 11 K were retrieved in the 0.3–16 THz frequency range, or the 1 mm–18.75 μm wavelength range. Two resonant absorption peaks of N2 ice, those above the detectable absorption level of our spectrometers, were observed at frequencies of 1.47 and 2.13 THz (204 and 141 μm) and attributed to the optically active translational phonon modes of the α-N2 molecular crystal. The 2.1 THz peak exhibits broadening and asymmetry, possibly due to anharmonicity effects or morphological features, such as porosity and polycrystallinity. A monotonic increase in absorption at higher frequencies (>8 THz), although below the detection limit, is attributed to the scattering on the ice heterogeneities and, thus, also highlights the imperfections in its structure.
The complex dielectric permittivity of N2 ice was modeled by a pair of the Lorentz kernels, which reproduce the observed vibrational modes; they have resonant frequencies (νL) of 1.47 and 2.13 THz and damping constants (γL) of 0.03 and 0.22 THz, respectively. The observed resonances were compared with the DFT prediction and the available literature data on the phonon spectrum of α-N2 molecular crystals. This made it possible to verify the correctness of our experimental findings and theoretical interpretations.
The DFT predicts the translational modes of α-N2 within 5 cm−1 of our findings. We have found that translational modes are sensitive to the geometrical structure of α-N2. Small variations in the interatomic distances, which are temperature-dependent, can drastically change the far-IR spectra.
Our optical constants for N2 ice cover the far-IR and sub-millimeter range, which is poorly sampled by current space-based observatories. While the James Webb Space Telescope (JWST) provides high-sensitivity coverage in the near- to mid-IR and the Atacama Large Millimeter/submillimeter Array (ALMA) operates at longer (submillimeter) wavelengths, a spectral gap remains in the far-IR (30–200 μm). Our data help fill this gap from the modeling side. Future instruments such as PRIMA (Probe far-InfraRed Mission for Astrophysics), currently in development, are expected to provide observational access to this range with high spectral resolution and sensitivity. In this context, the dielectric response of solid N2 obtained in this study provides valuable input for radiative transfer models of N2-rich environments, such as the outer regions of protoplanetary disks.
Finally, accurate optical constants across a broad spectral range are essential for modeling dust and ice in protoplanetary disks. Misestimates of the refractive index can lead to errors in radiative transfer calculations, in turn affecting the inferred disk temperature, density, and composition. Expanding the availability of laboratory measurements helps improve the reliability of disk models and provides deeper insights into the early stages of star and planet formation.
Data availability
The optical constants derived in this work are available at Zenodo: https://doi.org/10.5281/zenodo.18232391.
Acknowledgements
The authors appreciate the support of the Max-Planck Society. F.K. acknowledges support from the European Union’s Horizon Europe research and innovation programme under the Marie Skłodowska-Curie Actions Postdoctoral Fellowship grant agreement No. # 101153804 (ORCHID). This project has also received funding from the European Union’s Horizon 2020 research and innovation program under the Marie Skłodowska-Curie grant agreement # 811312 for the Project “Astro-Chemical Origins” (ACO). TPS and FTIR data processing and analysis by A.A.G., G.A.K., S.V.G., and K.I.Z. was supported by the RSF Project # 25–79–30006. D.C. acknowledges the Alexander von Humboldt Foundation for funding, as well as support from the University of Perugia with a postdoctoral research fundings (assegno di ricerca), the AIAS–AUFF Fellowship Programme, funded by Aarhus University Research Foundation and Aarhus Institute of Advanced Studies (AIAS) at Aarhus University, and from the Danish National Research Foundation through the Center of Excellence “InterCat” (Grant agreement no.: DNRF150). The authors acknowledges the state of Baden-Württemberg through bwHPC and the German Research Foundation (DFG) through grant no INST 40/575-1 FUGG (JUSTUS 2 cluster).
References
- Anderson, A., & Leroi, G. 1966a, J. Chem. Phys., 45, 4359 [Google Scholar]
- Anderson, A., & Leroi, G. E. 1966b, J. Chem. Phys., 45, 4359 [Google Scholar]
- Arabhavi, A. M., Woitke, P., Cazaux, S. M., et al. 2022, A&A, 666, A139 [NASA ADS] [CrossRef] [EDP Sciences] [Google Scholar]
- Banks, P. A., Song, Z., & Ruggiero, M. T. 2020, J. Infrared Millimeter Terahertz Waves, 41, 1411 [Google Scholar]
- Becke, A. D. 1993, J. Chem. Phys., 98, 5648 [Google Scholar]
- Bergren, M. S., Schuh, D., Sceats, M. G., & Rice, S. A. 1978, J. Chem. Phys., 69, 3477 [Google Scholar]
- Boogert, A. C. A., Gerakines, P. A., & Whittet, D. C. B. 2015, ARA&A, 53, 541 [Google Scholar]
- Chen, Y., Liu, H., Deng, Y., et al. 2004, Chem. Phys. Lett., 400, 357 [Google Scholar]
- Cutini, M., & Ugliengo, P. 2021, J. Chem. Phys., 155, 075102 [Google Scholar]
- Dash, J., Ray, S., Nallappan, K., et al. 2015, J. Phys. Chem. A, 119, 7991 [Google Scholar]
- Drążkowska, J., & Alibert, Y. 2017, A&A, 608, A92 [Google Scholar]
- Gavdush, A., Ivlev, A., Zaytsev, K., et al. 2025, A&A, 701, A287 [NASA ADS] [CrossRef] [EDP Sciences] [Google Scholar]
- Gavdush, A. A., Kruczkiewicz, F., Giuliano, B. M., et al. 2022, A&A, 667, A49 [NASA ADS] [CrossRef] [EDP Sciences] [Google Scholar]
- Gavino, S., Kobus, J., Dutrey, A., et al. 2023, A&A, 680, A59 [NASA ADS] [CrossRef] [EDP Sciences] [Google Scholar]
- Giuliano, B., Gavdush, A., Müller, B., et al. 2019, A&A, 629, A112 [NASA ADS] [CrossRef] [EDP Sciences] [Google Scholar]
- Griffiths, P., & de Haseth, J. 1986, Fourier Transform Infrared Spectroscopy (New York, NY, USA: John Wiley & Sons) [Google Scholar]
- Grimme, S. 2006, J. Comput. Chem., 27, 1787 [CrossRef] [PubMed] [Google Scholar]
- Gundlach, B., & Blum, J. 2015, ApJ, 798, 34 [Google Scholar]
- Hagen, W., & Tielens, A. G. G. M. 1981, J. Chem. Phys., 75, 4198 [Google Scholar]
- Hardy, J. R., & Karo, A. M. 1982, Phys. Rev. B, 26, 3327 [Google Scholar]
- Harris, F. 1978, Proc. IEEE, 66, 51 [NASA ADS] [CrossRef] [Google Scholar]
- Hily-Blant, P., Walmsley, M., Pineau Des Forêts, G., & Flower, D. 2010, A&A, 513, A41 [NASA ADS] [CrossRef] [EDP Sciences] [Google Scholar]
- Hudgins, D. M., Sandford, S. A., Allamandola, L. J., & Tielens, A. G. G. M. 1993, ApJS, 86, 713 [NASA ADS] [CrossRef] [Google Scholar]
- Jensen, F. 2014, J. Chem. Theory Comput., 10, 1074 [Google Scholar]
- Kambara, O. 2014, in 2014 39th International Conference on Infrared, Millimeter, and Terahertz waves (IRMMW-THz), 1 [Google Scholar]
- Kjems, J. K., & Dolling, G. 1975, Phys. Rev. B, 11, 1639 [Google Scholar]
- Kohin, B. C. 1960, J. Chem. Phys., 33, 882 [Google Scholar]
- Komandin, G., Zaytsev, K., Dolganova, I., et al. 2022, Opt. Express, 30, 9208 [Google Scholar]
- Lee, C., Yang, W., & Parr, R. G. 1988, Phys. Rev. B, 37, 785 [Google Scholar]
- Louis, R. V. S., & Schnepp, O. 1969, J. Chem. Phys., 50, 5177 [Google Scholar]
- Lucas, J., Geron, E., Ditchi, T., & Hole, S. 2012, AIP Adv., 2, 032144 [NASA ADS] [CrossRef] [Google Scholar]
- Martin, P. 1967, Phys. Rev., 161, 143 [NASA ADS] [CrossRef] [Google Scholar]
- Minissale, M., Aikawa, Y., Bergin, E., et al. 2022, ACS Earth Space Chem., 6, 597 [NASA ADS] [CrossRef] [Google Scholar]
- Müller, B., Giuliano, B. M., Bizzocchi, L., Vasyunin, A. I., & Caselli, P. 2018, A&A, 620, A46 [NASA ADS] [CrossRef] [EDP Sciences] [Google Scholar]
- Neese, F. 2003, J. Comput. Chem., 24, 1740 [Google Scholar]
- Neese, F., & Valeev, E. F. 2011, J. Chem. Theory Comput., 7, 33 [CrossRef] [Google Scholar]
- Neese, F., Wennmohs, F., Becker, U., & Riplinger, C. 2020, J. Chem. Phys., 152, 224108 [NASA ADS] [CrossRef] [Google Scholar]
- Öberg, K. I., Murray-Clay, R., & Bergin, E. A. 2011, ApJ, 743, L16 [Google Scholar]
- Oppenheim, K. C., Korter, T. M., Melinger, J. S., & Grischkowsky, D. 2010, J. Phys. Chem. A, 114, 12513 [Google Scholar]
- Qi, C., Öberg, K. I., Espaillat, C. C., et al. 2019, ApJ, 882, 160 [Google Scholar]
- Ron, A., & Schnepp, O. 1967, J. Chem. Phys., 46, 3991 [NASA ADS] [CrossRef] [Google Scholar]
- Savchenko, E., Khyzhniy, I., & Bondybey, V. 2019, Low Temp. Phys., 45, 975 [Google Scholar]
- Scott, T. 1976, Phys. Rep., 27, 89 [Google Scholar]
- Stoychev, G. L., Auer, A. A., & Neese, F. 2017, J. Chem. Theory Comput., 13, 554 [Google Scholar]
- Sturm, J. A., McClure, M. K., Bergner, J. B., et al. 2023, A&A, 677, A18 [NASA ADS] [CrossRef] [EDP Sciences] [Google Scholar]
- Tegler, S. C., Cornelison, D. M., Grundy, W. M., et al. 2010, ApJ, 725, 1296 [Google Scholar]
- Tegler, S. C., Grundy, W. M., Olkin, C. B., et al. 2012, ApJ, 751, 76 [Google Scholar]
- Tukey, J., Cleveland, W., & Brillinger, D. 1986, The Collected Works of John W. Tukey. Volume I: Time Series, 194–1964 (Wadsworth Statistics/Probability Series), 1st edn. (California: Wadsworth Advanced Books & Software) [Google Scholar]
- van ’t Hoff, M. L. R., Walsh, C., Kama, M., Facchini, S., & van Dishoeck, E. F. 2017, A&A, 599, A101 [CrossRef] [EDP Sciences] [Google Scholar]
- Walsh, C., Millar, T. J., Nomura, H., et al. 2014, A&A, 563, A33 [NASA ADS] [CrossRef] [EDP Sciences] [Google Scholar]
- Wang, Q., & Wang, H. 2012, Chem. Phys. Lett., 534, 72 [Google Scholar]
- Weigend, F., & Ahlrichs, R. 2005, Phys. Chem. Chem. Phys., 7, 3297 [Google Scholar]
- Wyckoff, R. 1963, Crystal Structures I, 1, 7 [Google Scholar]
- Zunger, A., & Huler, E. 1975, J. Chem. Phys., 62, 3010 [Google Scholar]
Appendix A DFT calculations
Table A.1 presents the far-IR vibrational frequencies of the α-N2 ice cluster model calculated using the B3LYP functional with different basis sets: Def2-SVP (Weigend & Ahlrichs 2005), pcseg-1 (Jensen 2014), ano-pvdz (Neese & Valeev 2011), and Def2-TZVP. The frequencies are shown both without (unrelaxed) and with (relaxed) optimization, except for the ano-pvdz basis set, which encountered convergence issues during optimization.
Without optimizing the structure, the Def2-TZVP basis set shows smaller deviations (1.43 and 4.93 cm−1) with respect to the experimental values, while the pcseg-1 basis set shows the highest deviations (10.45 and 14.62 cm−1). When adding the Grimme D3 dispersion correction (Grimme 2006), the frequencies exhibit a red shift of ≃ 4.66 cm−1 for the lowest vibrational mode and ≃ 8.15 cm−1 for the highest one.
When optimizing the experimental structure to a local minimum, the N2 intramolecular distances vary depending on the basis set, while the intermolecular N–N distances do not deviate significantly. After optimization, we noticed that the far-IR spectrum completely changes, giving rise to IR-active librations (oscillations along the center of mass of a diatomic molecule). This suggests that the far-IR region is strongly sensitive to the N2 interatomic distances. Hence, depending on the temperature, translational modes might vary or even disappear, giving rise to librational modes.
We expanded our cluster model by cutting it from a 3 × 3 × 3 bulk of α-N2 (Fig. A.1) and optimized it to evaluate the effect of size on reproducing the vibrational modes. Due to the large number of atoms, we were limited to using B3LYP/Def2-SVP due to computational constraints and only computed the partial Hessian numerically, making vibrational calculations only for the atoms within the 2 × 2 × 2 box. Optimization using B3LYP-D3 leads to the appearance of librational modes, as the dispersion correction in this case underestimates intramolecular bond distances by ≃ 0.35 Å compared to B3LYP without dispersion.
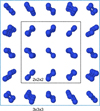 |
Fig. A.1 Balls-and-sticks model of the 3 × 3 × 3 cluster of α-N2 ice. It was derived by cutting a 3 × 3 × 3 repeated bulk using the same procedure adopted for obtaining the 2 × 2 × 2 cluster model, which is also schematically reported here for comparison. |
Benchmark of DFT frequencies and structural parameters for α-N2.
We note that the power absorption coefficient (within the radiative transfer theory) is given by μα = 2α.
All Tables
All Figures
|
Fig. 1 Reference and sample spectra of N2 ice, measured by the TPS (solid lines) and FTIR (dashed lines) spectrometers at specified deposition steps, tdep, and normalized by the maximum of the corresponding reference spectrum (for convenience). The low-frequency gray-shaded area shows the spectral range where distortions are expected owing to the THz beam diffraction at the sample aperture (Giuliano et al. 2019). The orange-shaded area near ≃2.0 THz (enlarged in the inset for clarity) indicates where the TPS and FTIR data overlap. The sensitivity of the TPS and FTIR measurements is characterized by the standard deviation of the corresponding instrumental noise, σTPS and σFTIR, as described by Gavdush et al. (2022). |
| In the text | |
|
Fig. 2 Merging of the TPS and FTIR data for N2 ice after the 54-minute-long deposition. (a) Amplitude of the complex transmission coefficient | |
| In the text | |
|
Fig. 3 Broadband THz–IR optical properties of the N2 ice, deduced from measurements of samples of different thicknesses (l). The solid yellow lines show the mean values, the green-shaded zones the ±1.5σ (87%) confidence intervals of the measurements, and the solid red lines the complex dielectric permittivity model defined by Eq. (3) and Table 1. (a) Refractive index (n). (b) and (c) Absorption coefficient (α; by field) in the linear and logarithmic scales, respectively. In (c), the solid blue lines define the 3σ detection limits for the absorption δα, calculated for the different ice thicknesses (l; measured with the ~0.01 mm uncertainty). In (a)–(c), the vertical dashed blue lines define the frequencies of the α-N2 vibrational modes predicted by the DFT method. |
| In the text | |
|
Fig. A.1 Balls-and-sticks model of the 3 × 3 × 3 cluster of α-N2 ice. It was derived by cutting a 3 × 3 × 3 repeated bulk using the same procedure adopted for obtaining the 2 × 2 × 2 cluster model, which is also schematically reported here for comparison. |
| In the text | |
Current usage metrics show cumulative count of Article Views (full-text article views including HTML views, PDF and ePub downloads, according to the available data) and Abstracts Views on Vision4Press platform.
Data correspond to usage on the plateform after 2015. The current usage metrics is available 48-96 hours after online publication and is updated daily on week days.
Initial download of the metrics may take a while.