Fig. 2
Download original image
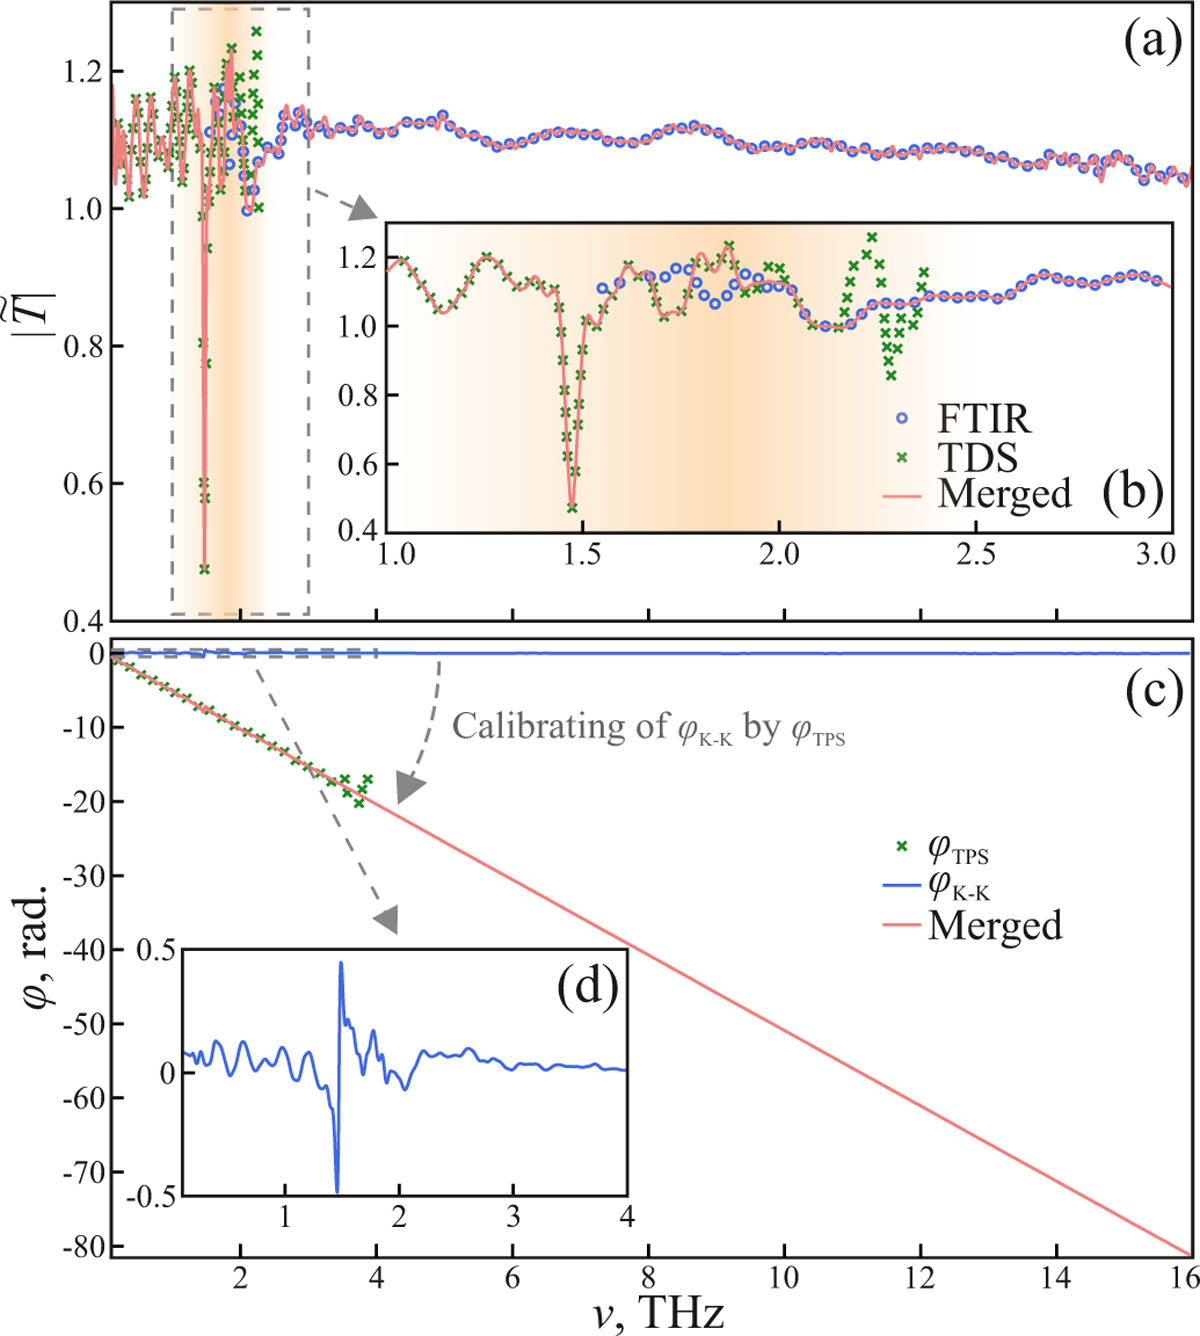
Merging of the TPS and FTIR data for N2 ice after the 54-minute-long deposition. (a) Amplitude of the complex transmission coefficient |![]() | retrieved from the TPS (green markers) and FTIR (blue) data, and the resultant merged curve (red); see Eqs. (1) and (2) for the definitions of the transmission coefficients. (b) Zoom-in on the overlapping TPS and FTIR data. (c) Phase of the complex transmission coefficient, ϕ(ν). The TPS phase, ϕTPS (green markers), FTIR-based Kramers-Kronig phase, ϕK–K (blue line), and resultant broadband phase (red) are shown. (d) Low-frequency behavior of the FTIR-based Kramers-Kronig phase, ϕK–K.
| retrieved from the TPS (green markers) and FTIR (blue) data, and the resultant merged curve (red); see Eqs. (1) and (2) for the definitions of the transmission coefficients. (b) Zoom-in on the overlapping TPS and FTIR data. (c) Phase of the complex transmission coefficient, ϕ(ν). The TPS phase, ϕTPS (green markers), FTIR-based Kramers-Kronig phase, ϕK–K (blue line), and resultant broadband phase (red) are shown. (d) Low-frequency behavior of the FTIR-based Kramers-Kronig phase, ϕK–K.
Current usage metrics show cumulative count of Article Views (full-text article views including HTML views, PDF and ePub downloads, according to the available data) and Abstracts Views on Vision4Press platform.
Data correspond to usage on the plateform after 2015. The current usage metrics is available 48-96 hours after online publication and is updated daily on week days.
Initial download of the metrics may take a while.