Fig. 1.
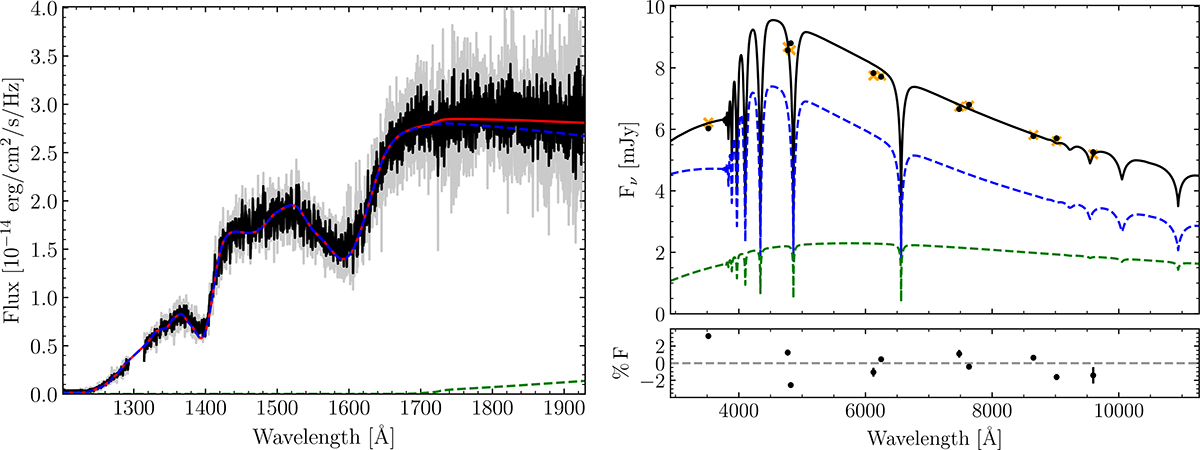
Download original image
Best-fitting solution for DA plus DA two-star model. Left panel: Fit to the HST COS spectrum. Right panel: Solution with photometric data. The synthetic flux from the hotter, pulsating white dwarf is shown in dashed blue while the flux from the cooler companion is shown in dashed green. In the left panel, the reduced spectrum is in grey, and the smoothed spectrum (across five data points) is in black. In the right panel, the synthetic flux in each filter is given as black circles, and the orange crosses are observed fluxes from the photometric surveys, with the percentage flux residual underneath. The total flux is in red on the left and black on the right for clarity.
Current usage metrics show cumulative count of Article Views (full-text article views including HTML views, PDF and ePub downloads, according to the available data) and Abstracts Views on Vision4Press platform.
Data correspond to usage on the plateform after 2015. The current usage metrics is available 48-96 hours after online publication and is updated daily on week days.
Initial download of the metrics may take a while.