Open Access
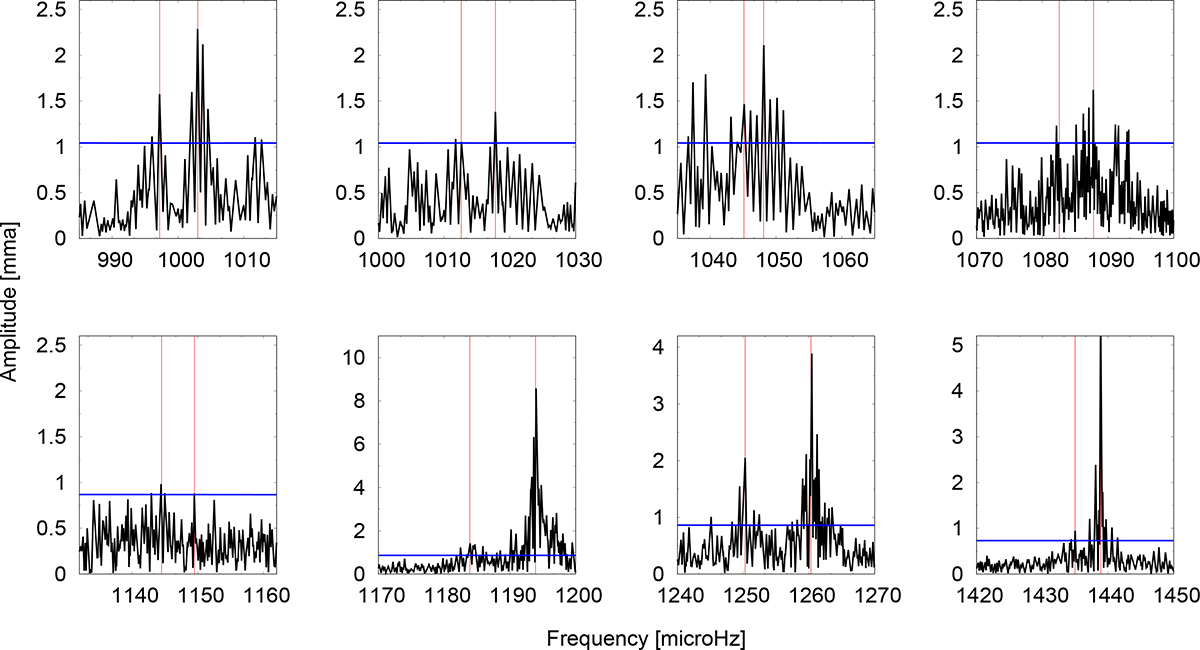
Fig. 4.
Download original image
Fourier spectra of possible rotational frequencies listed in Table 3. We note that we utilised pre-whitened Fourier spectra for the plots, as the lower-amplitude peaks become more clearly visible after pre-whitening. The horizontal blue lines indicate the significance levels corresponding to a 0.1% FAP for each dataset.
Current usage metrics show cumulative count of Article Views (full-text article views including HTML views, PDF and ePub downloads, according to the available data) and Abstracts Views on Vision4Press platform.
Data correspond to usage on the plateform after 2015. The current usage metrics is available 48-96 hours after online publication and is updated daily on week days.
Initial download of the metrics may take a while.