Open Access
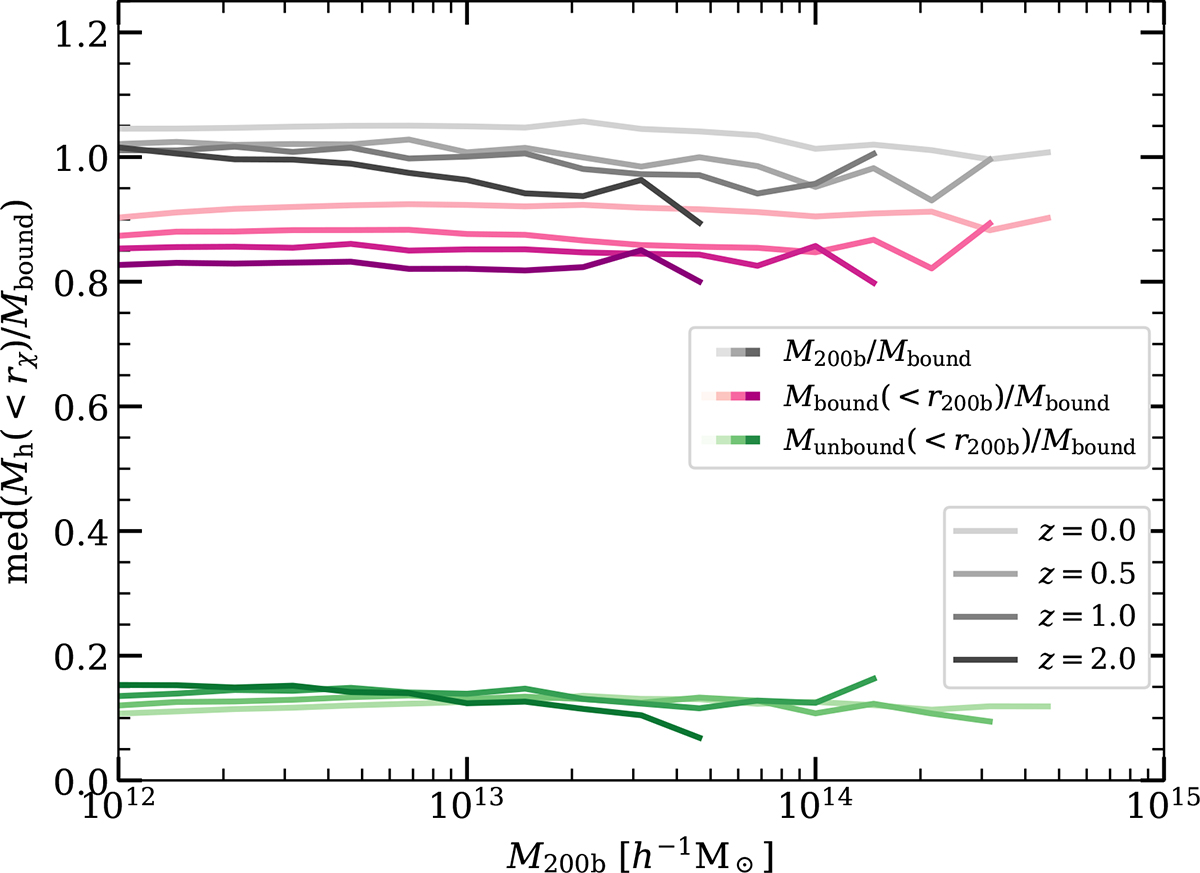
Fig. 10.
Download original image
Median mass ratios as a function of M200b. The colour of the lines correspond to the ratio en question, in grey M200b/Mbound, and in pink Mbound(< r200b)/Mbound. The shade of each line corresponds to the redshift, specifically, from brightest to darkest, z = 0, 0.5, 1.0, and 2.0.
Current usage metrics show cumulative count of Article Views (full-text article views including HTML views, PDF and ePub downloads, according to the available data) and Abstracts Views on Vision4Press platform.
Data correspond to usage on the plateform after 2015. The current usage metrics is available 48-96 hours after online publication and is updated daily on week days.
Initial download of the metrics may take a while.