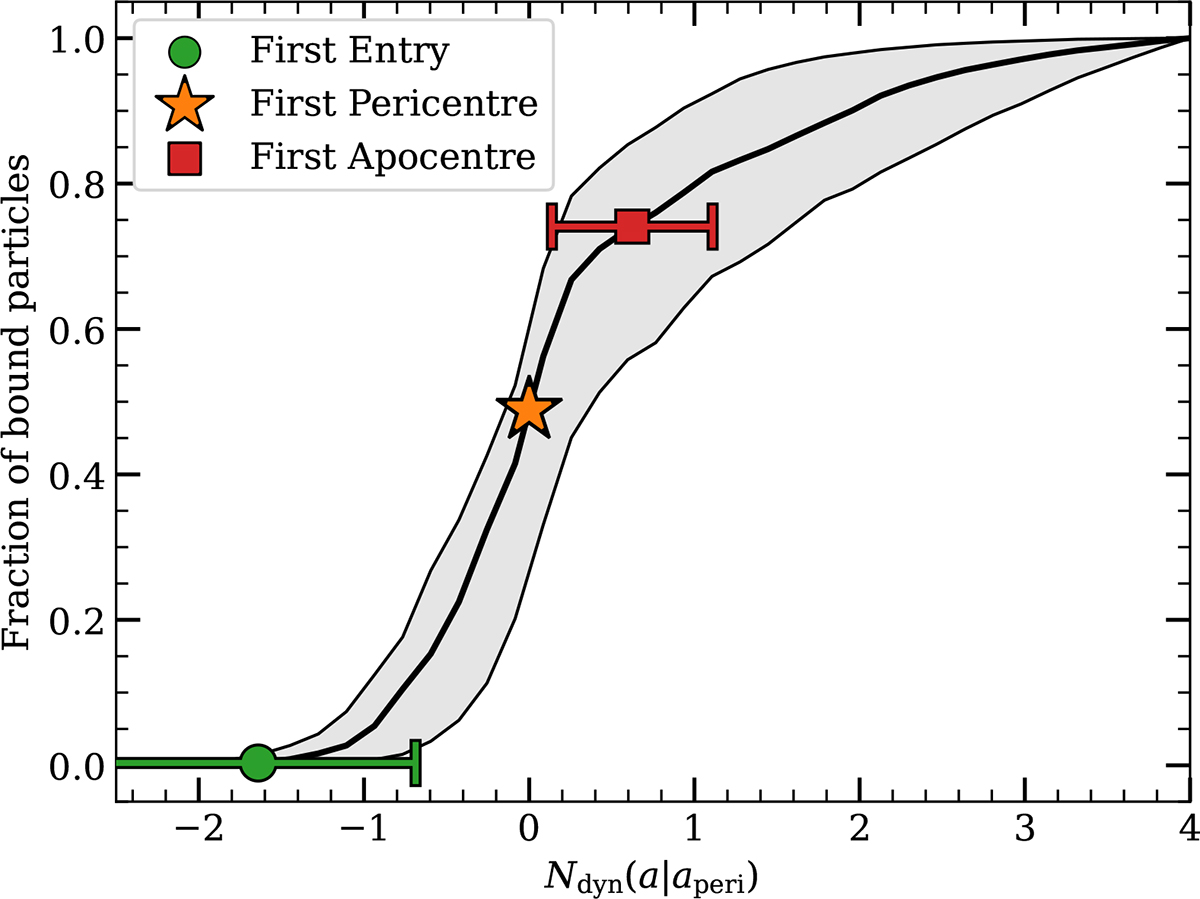
Fig. 5.
Download original image
Fraction of bound particles as a function of the number of dynamical times since the first pericentric passage, shown as the median, (solid black line) and 1-σ region (shaded area) as estimated over 100 haloes. The coloured points represent different events in a particle’s history, green, the particle enters the potential well, orange, the particle passes the pericentre of its orbit for the first time, and red, the particle reaches its first apocentre.
Current usage metrics show cumulative count of Article Views (full-text article views including HTML views, PDF and ePub downloads, according to the available data) and Abstracts Views on Vision4Press platform.
Data correspond to usage on the plateform after 2015. The current usage metrics is available 48-96 hours after online publication and is updated daily on week days.
Initial download of the metrics may take a while.