Open Access
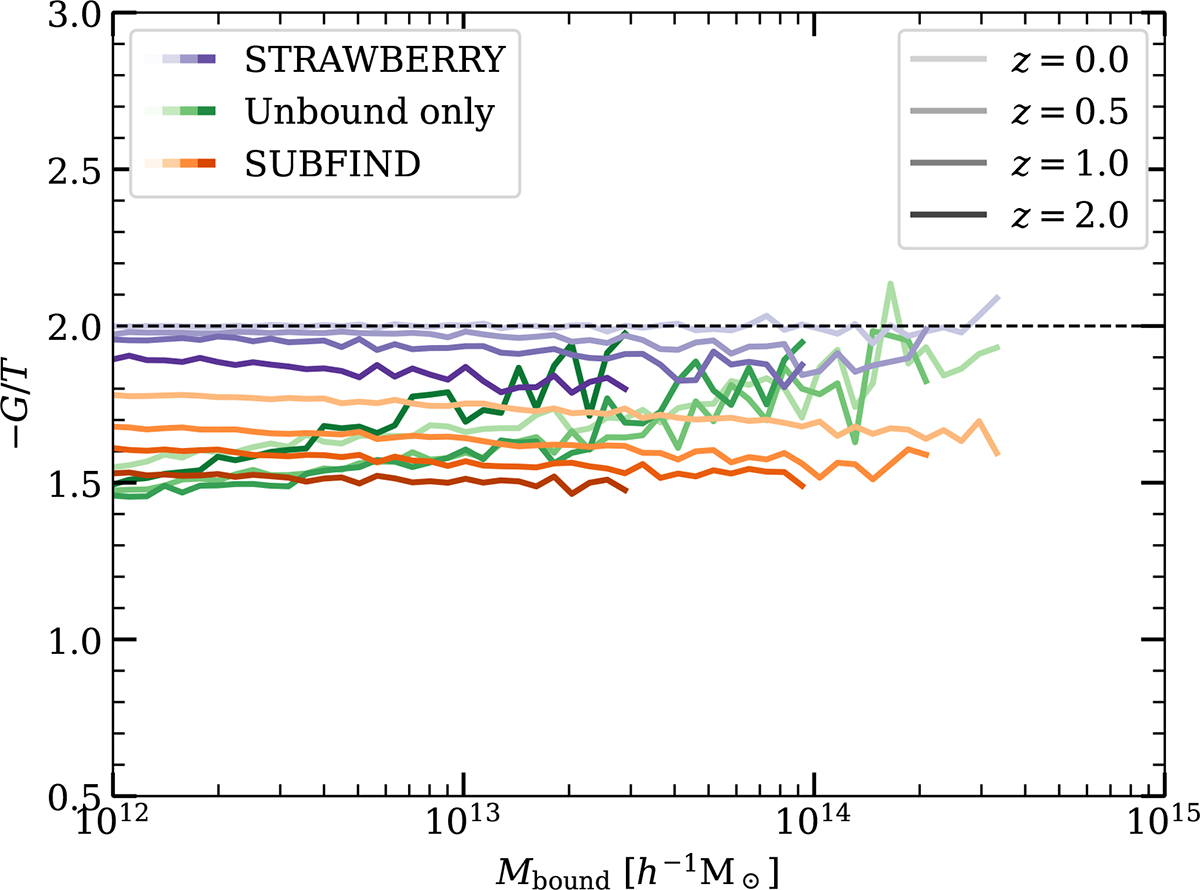
Fig. 9.
Download original image
Median viral ratios as a function of mass, in purple for STRAWBERRY selected particle distributions, in green particles unbound by STRAWBERRY, and in orange for SUBFIND selected particle distributions. The brightness of each curve corresponds to the redshift of the sample, with darker tones representing higher redshifts.
Current usage metrics show cumulative count of Article Views (full-text article views including HTML views, PDF and ePub downloads, according to the available data) and Abstracts Views on Vision4Press platform.
Data correspond to usage on the plateform after 2015. The current usage metrics is available 48-96 hours after online publication and is updated daily on week days.
Initial download of the metrics may take a while.