Fig. 2
Download original image
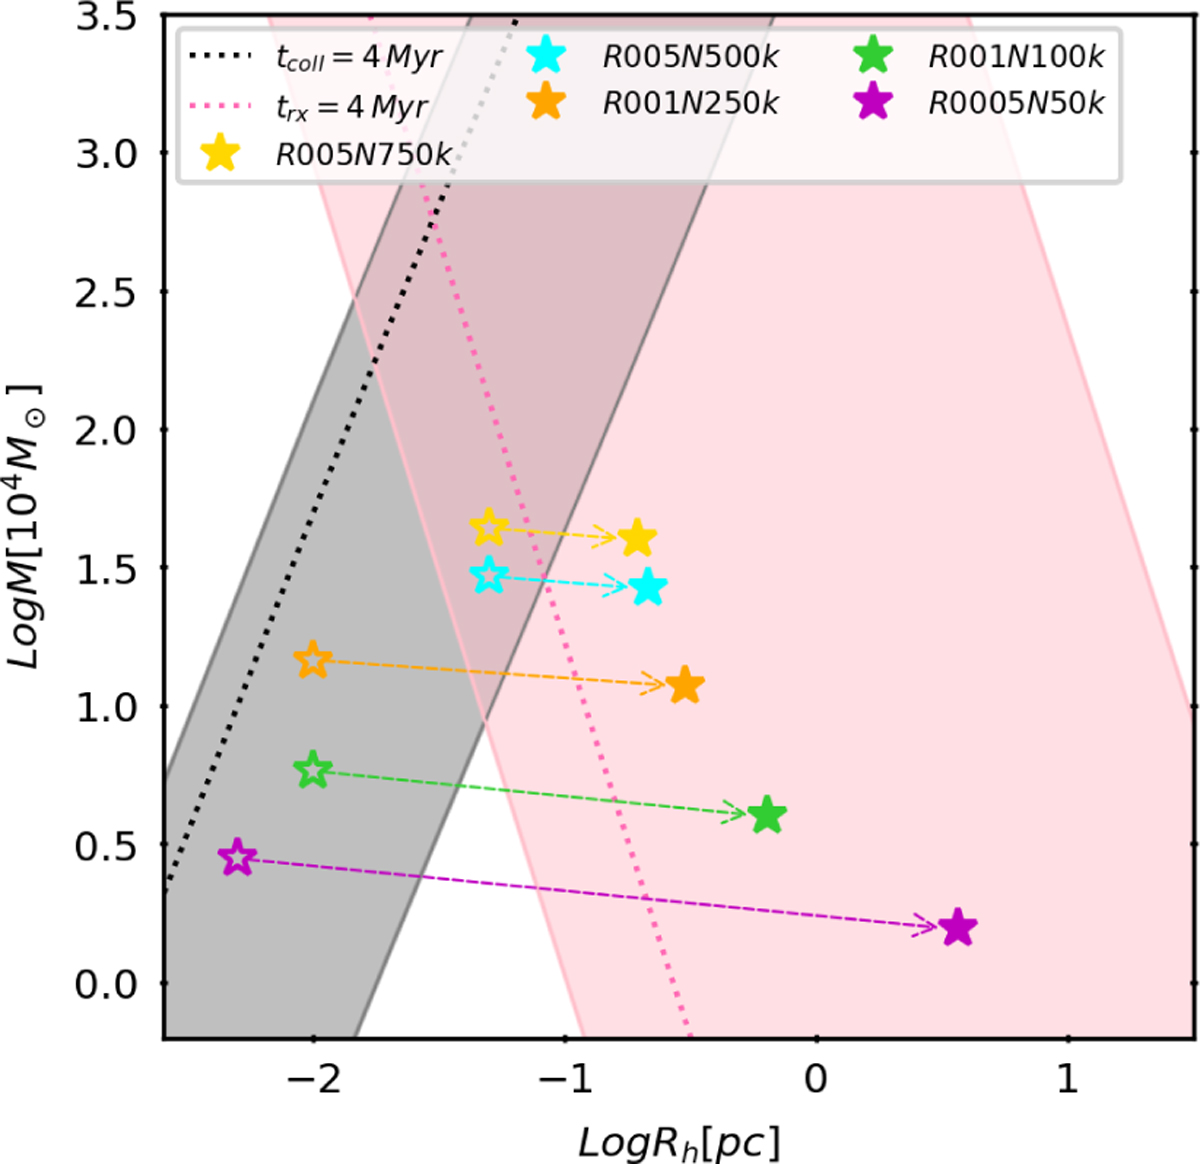
Initial and final masses and half-mass radii of the clusters. The dotted lines represent when the timescales (tcoll and trx) are equal to τ = 4 Myr. The shaded regions indicate the parameter space where the respective timescales fall within the range 1 Myr ≤ τ ≤ 10 Gyr, highlighting different dynamical regimes: pink for two-body relaxation and gray for stellar collisions. Our clusters R0005N50k, R001N100k, R001N250k, R005N500k, and R005N750k evolve for 3.73, 3.81, 3.64, 3.80, and 3.87 Myr, respectively. We show their initial conditions with empty symbols and the final conditions with filled symbols, connected by arrows.
Current usage metrics show cumulative count of Article Views (full-text article views including HTML views, PDF and ePub downloads, according to the available data) and Abstracts Views on Vision4Press platform.
Data correspond to usage on the plateform after 2015. The current usage metrics is available 48-96 hours after online publication and is updated daily on week days.
Initial download of the metrics may take a while.