Fig. 6
Download original image
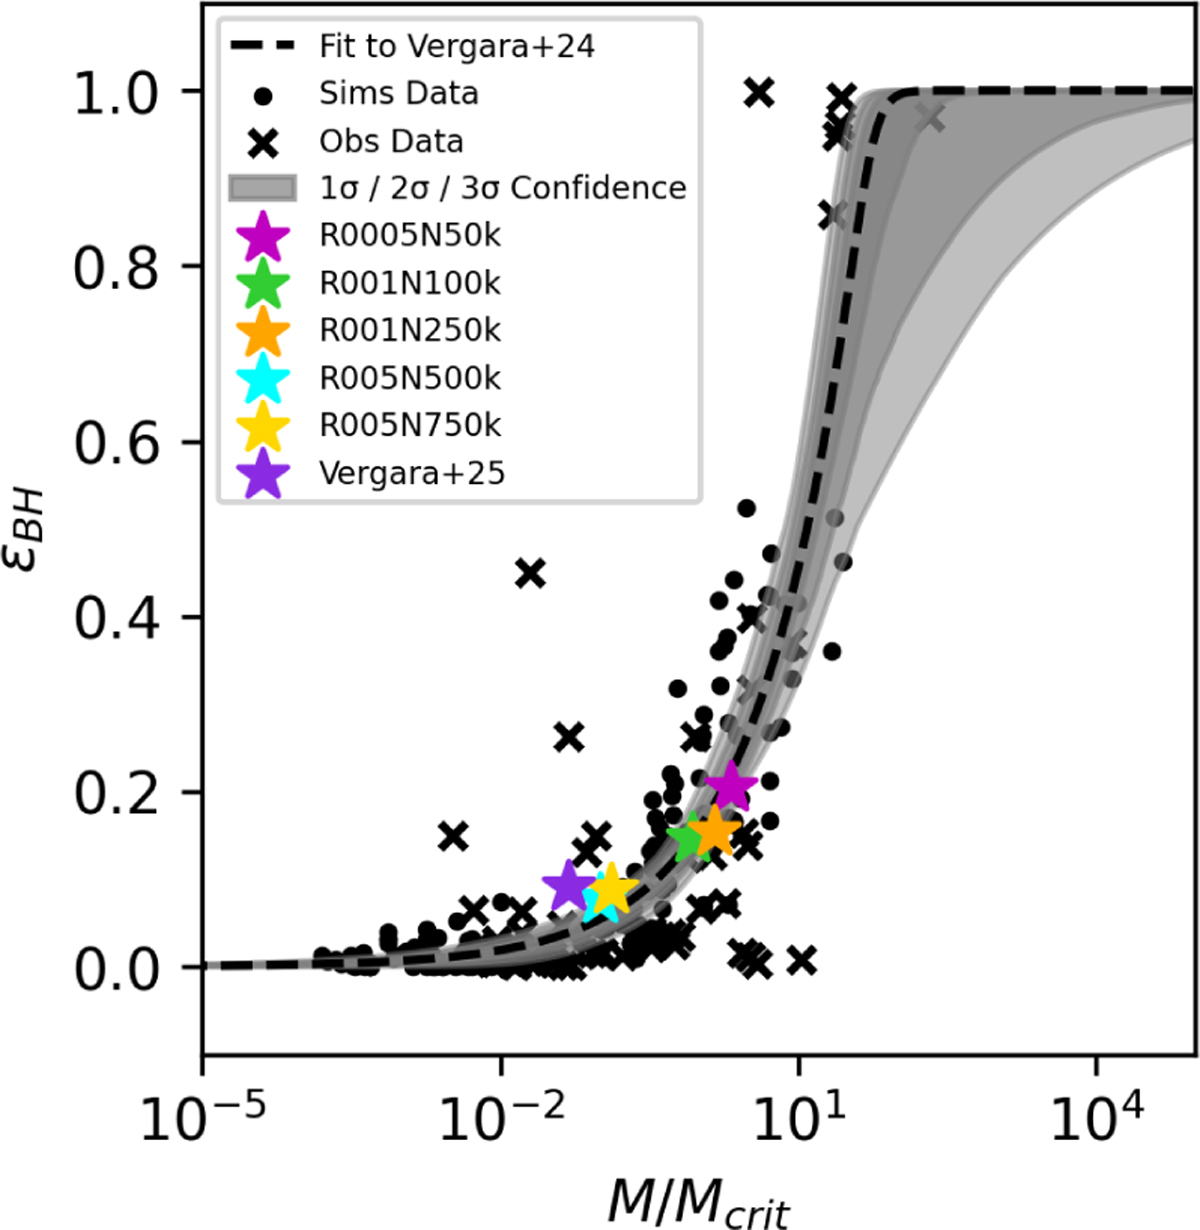
BH formation efficiency as a function of the ratio of initial cluster mass to critical mass. The figure has been reproduced from Vergara et al. (2024); we fit an asymmetric sigmoid function, represented by the dashed black line. The shaded gray bands represent the confidence intervals estimated by bootstrap resampling: the darker, middle, and lighter gray bands correspond to the 1σ, 2σ, and 3σ uncertainty regions. These intervals quantify the uncertainty in the fit curve, arising from data variability. We added the simulation from Vergara et al. (2025) and the simulations from this work.
Current usage metrics show cumulative count of Article Views (full-text article views including HTML views, PDF and ePub downloads, according to the available data) and Abstracts Views on Vision4Press platform.
Data correspond to usage on the plateform after 2015. The current usage metrics is available 48-96 hours after online publication and is updated daily on week days.
Initial download of the metrics may take a while.