Fig. 1
Download original image
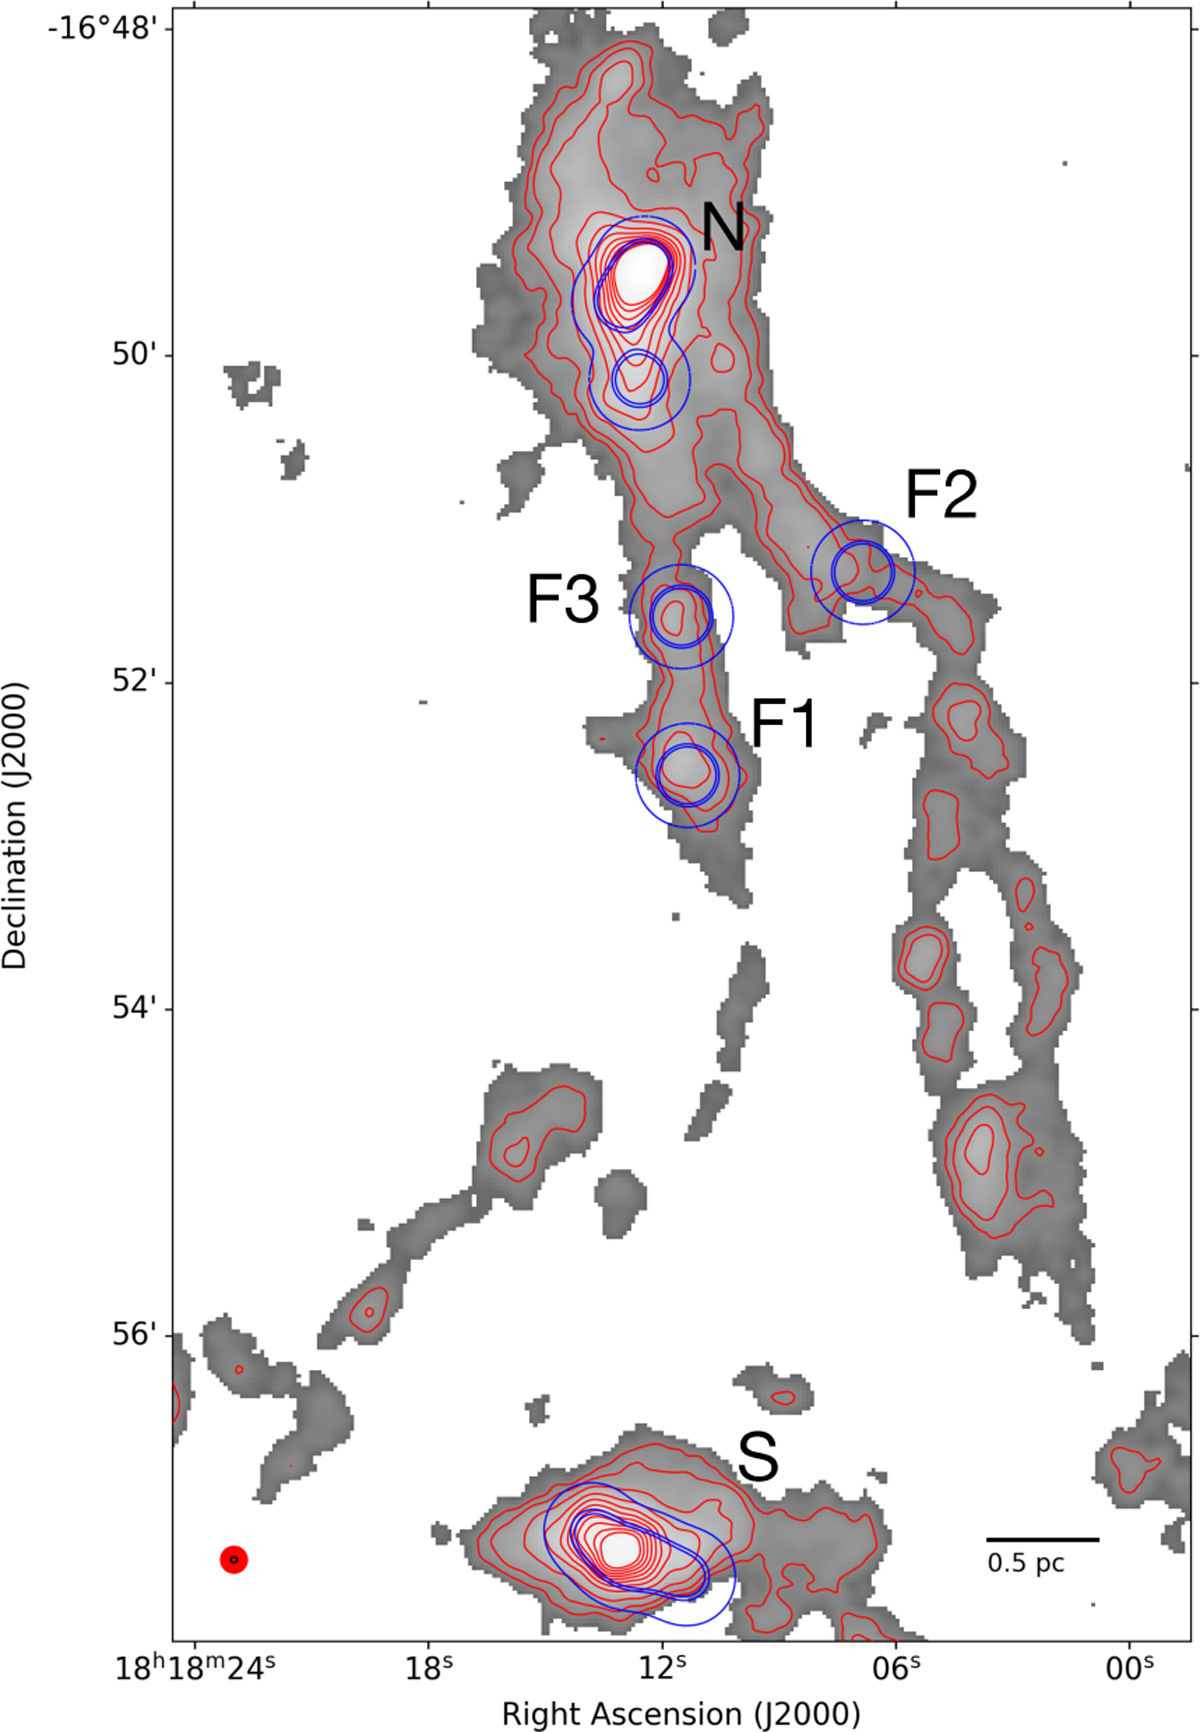
CSO continuum emission at 350 μm (gray map) and red contours, which depict [3, 6, 9, 15, 25, 35, 45, 55, 65, 75, 85, and 95] times the rms noise (80 mJy beam−1). The red and black circles in the lower left corner show the CSO and ALMA beam size, respectively. Blue contours represent the 80%, 40%, and 33% levels of the ALMA primary beam for each target region, labeled N, F1, F2, F3, and S.
Current usage metrics show cumulative count of Article Views (full-text article views including HTML views, PDF and ePub downloads, according to the available data) and Abstracts Views on Vision4Press platform.
Data correspond to usage on the plateform after 2015. The current usage metrics is available 48-96 hours after online publication and is updated daily on week days.
Initial download of the metrics may take a while.