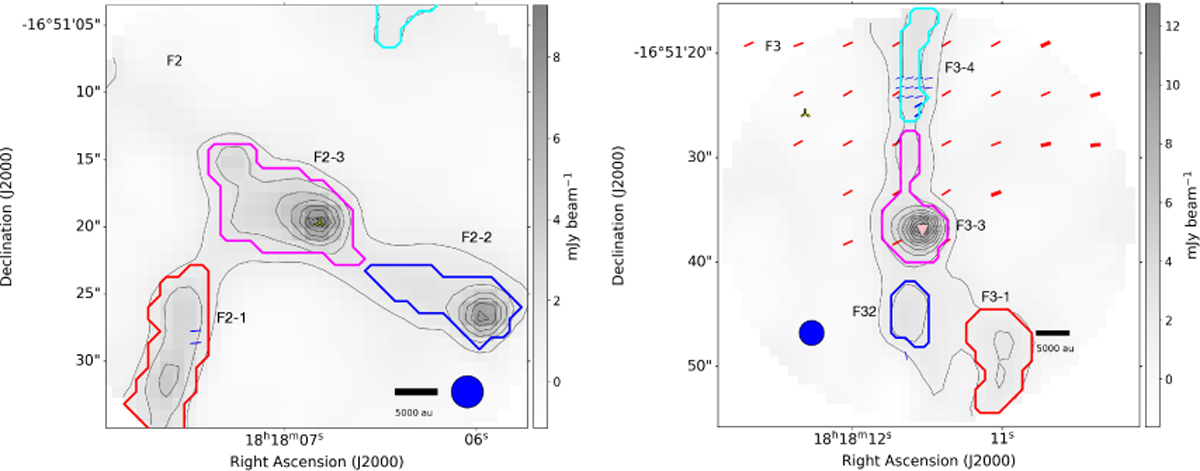
Fig. B.1
Download original image
1.39 mm continuum emission, toward region F2 (left panel) and region F3 (right panel), in contours that depict [10, 20, 30, 40, 50, 60, 70, 80, 90, 100, 150, 300, 500, and 700] times the rms noise (0.12 mJy beam−1), overlapped with magnetic field segments in blue, where thin and thick segments depict segments within the inner 50% and 40% of the primary beam model, respectively. At 350 μm, the red segments show the CSO magnetic field. The thin segments have a polarization intensity between two and three sigmas, and the thick segments have an intensity greater than three times sigma (CSO sigma =0.02 Jybeam−1 Añez-López et al. 2020). Color contours show leaves from dendrogram analysis, also black label present the corresponding ID label. Blue solid circle depict the ALMA beam size. The Pink triangle shows the H2 O maser detected in Wang et al. (2006). Yellow tripods depict radio sources detected at 6 cm (C-band) by Díaz-Márquez et al. (2024). White tripods show NH3 cores detected by Ohashi et al. (2016).
Current usage metrics show cumulative count of Article Views (full-text article views including HTML views, PDF and ePub downloads, according to the available data) and Abstracts Views on Vision4Press platform.
Data correspond to usage on the plateform after 2015. The current usage metrics is available 48-96 hours after online publication and is updated daily on week days.
Initial download of the metrics may take a while.