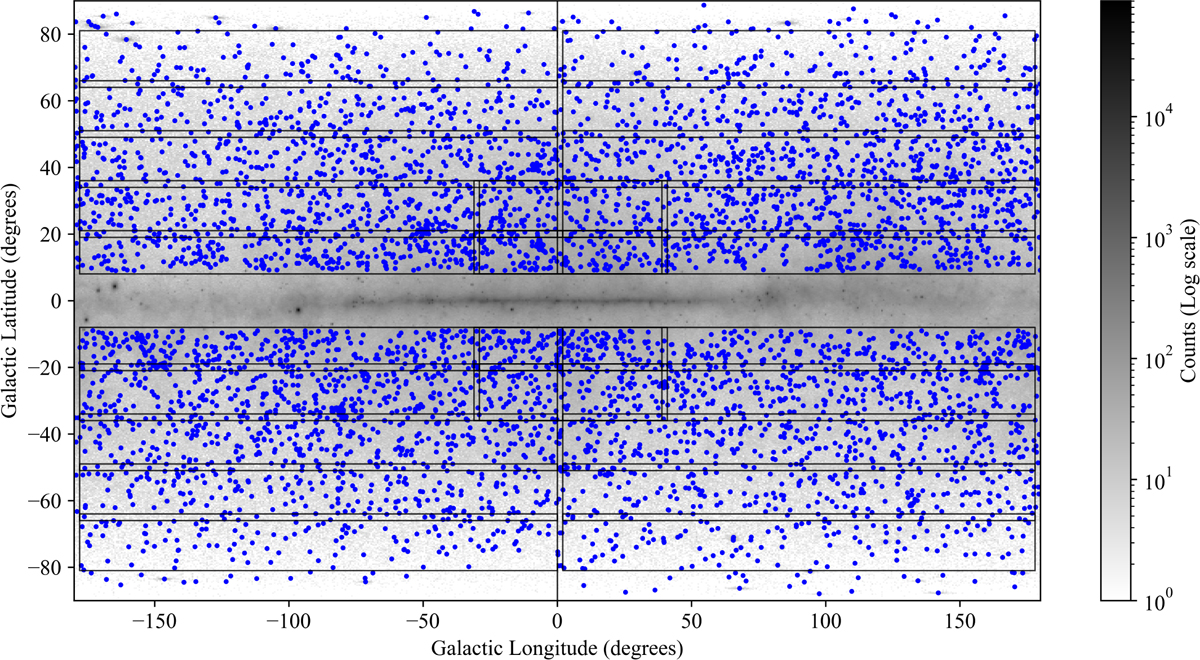
Fig. 1
Download original image
Photon count map showing the 30 overlapping analysis regions, based on the 9Y-MST tiling scheme with additional fields added near the Galactic plane (10° < |b| < 20°). Each region overlaps adjacent fields by 2° to reduce edge effects during source detection. The inner Galactic plane (|b| ≤ 10°) is excluded from the analysis due to intense diffuse gamma-ray emission. DBSCAN clusters are denoted by blue circles
Current usage metrics show cumulative count of Article Views (full-text article views including HTML views, PDF and ePub downloads, according to the available data) and Abstracts Views on Vision4Press platform.
Data correspond to usage on the plateform after 2015. The current usage metrics is available 48-96 hours after online publication and is updated daily on week days.
Initial download of the metrics may take a while.