| Issue |
A&A
Volume 707, March 2026
|
|
|---|---|---|
| Article Number | A61 | |
| Number of page(s) | 6 | |
| Section | Numerical methods and codes | |
| DOI | https://doi.org/10.1051/0004-6361/202556902 | |
| Published online | 03 March 2026 | |
A catalog of gamma-ray source candidates from 16 years of Fermi-LAT data at |b| > 10°
Department of Physics, K. N. Toosi University of Technology,
PO Box 15875-4416,
Tehran,
Iran
★ Corresponding author: This email address is being protected from spambots. You need JavaScript enabled to view it.
Received:
19
August
2025
Accepted:
29
December
2025
Abstract
Context. Sixteen years of continuous observations with the Fermi Large Area Telescope (LAT) provide an unprecedented opportunity to search for faint or previously unrecognized γ-ray emitters, particularly at high energies where the angular resolution improves and the diffuse background is reduced.
Aims. We present a new catalog of γ-ray source candidates identified using a data-driven, clustering-based analysis of Pass 8 LAT data above 3 GeV at Galactic latitudes of |b| > 10°.
Methods. The pipeline integrates the SIeving MEthod for FInding Core, version 3 (SIMEFIC III), for photon denoising with the density-based spatial clustering of applications with noise (DBSCAN) algorithm.
Results. We detect 3112 γ-ray cluster candidates, of which 2932 are associated with known γ-ray sources. Crossmatching yields 37 counterparts in 1CGH, 23 in CRATES, 21 in Roma-BZCAT, and 17 in MST-12yr. The remaining 370 clusters have no known γ-ray counterpart and are proposed as new source candidates.
Key words: methods: data analysis / methods: numerical / methods: statistical / catalogs
© The Authors 2026
 Open Access article, published by EDP Sciences, under the terms of the Creative Commons Attribution License (https://creativecommons.org/licenses/by/4.0), which permits unrestricted use, distribution, and reproduction in any medium, provided the original work is properly cited.
This article is published in open access under the Subscribe to Open model. This email address is being protected from spambots. You need JavaScript enabled to view it. to support open access publication.
1 Introduction
The Fermi Gamma-ray Space Telescope, launched in 2008, has revolutionized gamma-ray astronomy by surveying the entire sky every ~3 hours (approximately two orbits) and collecting unprecedented volumes of high-energy astrophysical data (Ackermann et al. 2012). Its primary instrument, the Large Area Telescope (LAT) (Atwood et al. 2009), detects gamma rays from ~20 MeV to >1 TeV, recording each photon’s arrival time, direction, and energy (Abdollahi et al. 2022).
The LAT is a pair-conversion telescope comprising three subsystems:
Tracker (converter): incoming gamma rays interact with high-Z material, converting to electron-positron pairs. The trajectories of these charged particles enable reconstruction of the original gamma-ray direction.
Calorimeter: measures the energy of the pair by absorbing and sampling the electromagnetic shower.
Anticoincidence detector (ACD): surrounds the tracker and vetoes charged-particle backgrounds via coincident signal rejection.
When analyzing photon directions (sky coordinates), LAT data produce 2D sky maps where point sources manifest as localized excesses of gamma-ray events. Traditional point-source detection in LAT data – similar to its predecessor EGRET (Kanbach et al. 1989) – relies on maximum likelihood estimation. A source is considered significantly detected if the test statistic (TS) exceeds 25, where TS is defined as
 (1)
with ℒ denoting the maximum likelihood of the model including the source and L0 the likelihood without it (Mattox et al. 1996). Following the Fermi-LAT convention and the TS-σ relation discussed in Arsioli et al. (2025, footnote 3), a detection threshold of TS ≈ 25 corresponds to a significance of approximately 4σ, while TS ≈ 12 corresponds to ~ 3σ when considering two degrees of freedom.
(1)
with ℒ denoting the maximum likelihood of the model including the source and L0 the likelihood without it (Mattox et al. 1996). Following the Fermi-LAT convention and the TS-σ relation discussed in Arsioli et al. (2025, footnote 3), a detection threshold of TS ≈ 25 corresponds to a significance of approximately 4σ, while TS ≈ 12 corresponds to ~ 3σ when considering two degrees of freedom.
However, the LAT’s high sensitivity and the increasing source density within small regions of interest (ROIs) render likelihood-based model fitting computationally prohibitive (Starck et al. 2009). As a result, non-parametric methods have gained traction in astrophysics over the past two decades due to their computational efficiency and minimal model assumptions. Several algorithms adapted for LAT data leverage local photon density, including minimum spanning trees (MST), as described by Campana et al. (2008), and DBSCAN (Tramacere & Vecchio 2013). While faster than likelihood-based methods, these techniques require careful background suppression and hyperparameter tuning.
In this study, we detect gamma-ray point sources by applying the SIMEFIC III denoising algorithm to LAT data prior to clustering (see Hedayati Kh. et al. (2024); Soor et al. (2025) for details). By effectively reducing background contamination, SIMEFIC III facilitates the use of simpler clustering algorithms that are less sensitive to hyperparameter selection.
In Section 2, we outline our methodology for analyzing the Fermi-LAT data. Section 3 provides an overview of the DBSCAN algorithm, discussing its implementation in our analysis as well as the parameters that were carefully tuned to optimize source detection. Section 4 provides an overview of the SIMEFIC III. In Section 5, we present the results of our analysis, including a detailed breakdown of identified gammaray sources, their classifications, and associations with existing catalogs. Finally, in Section 6, we conclude with a discussion of our findings.
Comparison of energy thresholds in Fermi-LAT analyses.
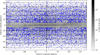 |
Fig. 1 Photon count map showing the 30 overlapping analysis regions, based on the 9Y-MST tiling scheme with additional fields added near the Galactic plane (10° < |b| < 20°). Each region overlaps adjacent fields by 2° to reduce edge effects during source detection. The inner Galactic plane (|b| ≤ 10°) is excluded from the analysis due to intense diffuse gamma-ray emission. DBSCAN clusters are denoted by blue circles |
2 Event selection and sky partitioning
We analyzed 16 years of Fermi-LAT Pass 8 data (August 4, 2008, to August 4, 2024) from the Fermi Science Support Center (FSSC) archive. We selected Source-class events (evclass = 128) with energies of E > 3 GeV, balancing angular resolution and photon statistics (see Table 1). At 3 GeV, the LAT point spread function (PSF) improves to ~0.3° (68% containment) compared to 0.8° at 1 GeV, while retaining ~40% of the photon flux, providing an optimal compromise for detecting faint sources in crowded regions. The following event selection criteria were applied:
Event class: Source (evclass = 128).
Event type: Both front- and back-converting events (evtype = 3).
Zenith angle: ≤105° (to minimize Earth limb contamination).
Data quality: DATA_QUAL==1 && LAT_CONFIG==1 && |ROCK_ANGLE| > 52°.
To account for the nonuniform photon distribution across the sky, we divided the gamma-ray sky into 30 ROIs:
22 regions follow the 9Y-MST tiling (Campana et al. 2018).
8 additional regions along the Galactic plane (10° < |b| < 20°) for enhanced coverage.
Each ROI has a 2° overlap with neighboring regions to mitigate edge effects. The Galactic plane (|b| < 10°) was excluded due to: (1) dominant diffuse gamma-ray emission, (2) significant background contamination, and (3) challenges in reliable point source identification in complex emission regions.
The final dataset contains 3 198 820 photons with E > 3 GeV, roughly 10× more photons than the 324 133 photons above 10 GeV in the 12Y-MST catalog (Campana & Massaro 2021). Figure 1 shows the ROI layout, while Table 2 provides the region parameters in detail.
30 sky regions with a 2° overlap.
3 SIMEFIC III algorithm overview
The SIMEFIC III algorithm is a denoising technique designed for datasets with numerous localized intensity peaks embedded in substantial background noise. Instead of modifying the intrinsic characteristics of these peaks, it suppresses interstitial noise, thereby making their locations more distinct and easier to identify. Although not originally developed specifically for gamma-ray photon maps, its application to such data has yielded promising results.
SIMEFIC III works by quantifying local density variations to identify regions of locally elevated intensity that deviate from the expected background behavior. Through this approach, the algorithm selectively suppresses background fluctuations, while preserving key signal features.
By reducing spurious noise and emphasizing genuine local extrema, SIMEFIC III prepares data for downstream analysis. For example, when paired with clustering methods such as DBSCAN, the denoised dataset enhances source detection reliability by decreasing false positives, especially in regions with complex spatial structures.
For a detailed discussion of the SIMEFIC III denoising method, refer to Hedayati Kh. et al. (2024), which outlines its theoretical foundations, performance in high-noise environments, and use as a preprocessing tool. An enhanced, iterative version of SIMEFIC III that applies multiple denoising passes to further improve signal extraction is presented in our follow-up study (Soor et al. 2025).
The denoising algorithm was applied iteratively to each of the 30 analysis regions. After each iteration, photons with IDs greater than the average were removed, progressively reducing background noise. This process continued until an optimal denoising step was identified for each region. The selected step numbers – representing the best trade-off between noise suppression and source retention – are listed in Table 2. The optimal step for each region was defined as the one in which the remaining clusters exhibited the highest correspondence with known Fermi-LAT sources having a TS greater than 25. Specifically, the optimal step maximized the number of clusters lying within a minimal angular distance of such Fermi sources (see Soor et al. (2025) for details).
4 DBSCAN clustering
Density-based spatial clustering of applications with noise (DBSCAN; Ester et al. (1996)) is a clustering algorithm that utilizes two key parameters: epsilon (ε), which defines the neighborhood radius around each point, and minimum points (MinPts), which specifies the minimum number of neighboring points required for a point to be classified as a core point. The algorithm categorizes points as core, border, or noise and links core points to form clusters of high density.
We applied the DBSCAN algorithm to identify photon clusters in Fermi-LAT data. The performance of DBSCAN is sensitive to the choice of ε and MinPts, and these parameters must be tuned based on the specific characteristics of the dataset. According to Tramacere & Vecchio (2013), the parameter ε is related to the PSF of the LAT detector. Although our analysis uses photons with energies above 3 GeV, we adopt ε = 0.1° following Campana et al. (2022), who associate this scale with the Fermi- LAT PSF at 10 GeV. This conservative choice favors the detection of compact, high-confidence clusters and helps suppress spurious associations in crowded fields. The MinPts parameter, denoted as K, was estimated for each region using the method described by Campana et al. (2022):
-
Average photon density: K was initially estimated based on the average photon density,
 (2)
(2)where
 is the solid angle of the extraction region, Ωε is the solid angle of a circle with radius ε, and Ntot is the total number of photons within the extraction region.
 Background density estimation: To estimate the background density, Dbkg, we ran DBSCAN with K = Kave + Kfrac
 , where Kfrac = 3.5.
Background K Estimation: The background K was then calculated as
 (3)
(3)Final K value: the final value of K used in DBSCAN was computed as
 (4)
(4)
For each photon field, the final estimated value of K is listed in Table 2. This value was held constant throughout the DBSCAN iterations for denoising.
To assess the statistical significance of the clusters identified by DBSCAN, we applied the likelihood ratio method introduced by Li & Ma (1983):
 (5)
where Non represents the number of photons in the cluster region, and Noff is the number of background photons. This expression provides a quantitative measure of cluster significance, facilitating the discrimination between genuine sources and background fluctuations.
(5)
where Non represents the number of photons in the cluster region, and Noff is the number of background photons. This expression provides a quantitative measure of cluster significance, facilitating the discrimination between genuine sources and background fluctuations.
We adopted a threshold of S = 2 for source significance, rejecting clusters with S < 2 as noise. The SIMEFIC algorithm was applied iteratively to the dataset, and DBSCAN was reapplied in each iteration to refine the cluster selection.
Astronomical catalogs used for crossmatching.
5 SIMEFIC III catalog
To evaluate the performance of our point-source detection pipeline, we built a preliminary catalog of gamma-ray sources based on DBSCAN clusters extracted from SIMEFIC III- denoised photon data. This catalog includes 3112 clusters that are spatially compact, statistically significant, and consistent with the expected characteristics of astrophysical gamma-ray sources.
For each identified cluster, we determined its centroid coordinates (Galactic longitude and latitude, as well as right ascension and declination). The centroid was computed using a SIMEFIC- weighted average of photon positions, as described in our previous work Soor et al. (2025), ensuring a more accurate representation of the spatial distribution of significant local maxima within the cluster.
To suppress contamination from background noise, we applied a conservative photon multiplicity threshold of Nγ ⩾ 4, based on both simulations of the isotropic background and empirical studies of low-count Poisson fluctuations.
5.1 4FGL-DR4 associated clusters
We crossmatched the resulting source catalog with the Fermi- LAT Fourth Source Catalog Data Release 4 (4FGL-DR4; Ballet et al. 2024), which lists 7194 sources detected between 50 MeV and 1 TeV. For this comparison, we adopted a matching radius of 0.15°, corresponding to the median PSF containment radius of the LAT above ~3 GeV: ~0.1° for front-converting and ~0.2° for back-converting events. This choice balances completeness against reliability, preventing the loss of true associations at <0.1°, while minimizing false matches at >0.3°, in line with 4FGL-DR2/DR4 and MST-12yr methodologies for robust >1 GeV source associations.
Using this criterion, 2822 clusters were associated with 4FGL-DR4 sources. Unmatched clusters were flagged as candidate new detections and further evaluated to exclude spurious signals arising from instrumental artifacts or diffuse background fluctuations. As an additional validation step, photon maps were visually inspected.
It is important to note that our analysis covers 16 years of Fermi-LAT observations (August 2008–August 2024), whereas 4FGL-DR4 is based on the first 14 years. Consequently, some of our detections may appear with enhanced significance or may be absent from 4FGL-DR4 due to the increased photon statistics in our dataset.
5.2 New gamma-ray source candidates
To broaden source identification, we crossmatched our catalog with the additional γ—ray and multiwavelength catalogs listed in Table 3, using the same 0.15° radius adopted for the 4FGL-DR4 associations. The crossmatch yielded 112 counterparts, with the distribution of matches summarized in Table 3.
A subset of 370 DBSCAN-identified clusters showed no positional association with 4FGL-DR4 sources or any other known gamma-ray or multiwavelength catalog and were flagged as new gamma-ray source candidates. These clusters constitute promising targets for follow-up analyses in future Fermi-LAT data releases and multiwavelength studies, particularly in regions with limited prior coverage or high source confusion. As with 4FGL-DR4 associations, candidate clusters were required to satisfy Nγ ⩾ 4 and were visually inspected on photon maps to exclude artifacts arising from diffuse backgrounds or instrumental effects.
Figure 3 shows a 10° × 10° region centered at Galactic coordinates (l = 133.3°, b = −59.6°), representing a subsection of Region 4 (South). After applying the denoising procedure at the third iteration, the DBSCAN algorithm (minimum cluster size of four photons) was executed. The resulting clusters are displayed in distinct colors. For each cluster, a search within a 0.15° radius of its centroid was performed to identify possible counterparts in various gamma-ray and multiwavelength catalogs, as summarized in the accompanying catalog list.
Each candidate source is assigned a unique identifier of the form SIM_# JHHMM.m+DDMMaa, where SIM denotes a SIMEFIC- identified source and # refers to the denoising stage at which the source was last detected before potential removal in later iterations. The source name encodes its J2000 coordinates using a standard convention.
The full catalog (Gamma_SimCAT_v1.0), providing a comprehensive summary of all remaining clusters (i.e., new source candidates not associated with 4FGL-DR4 or any other known catalog), is available at the CDS (see Data availability section). For each cluster, it lists the centroid coordinates, the number of constituent photons (Nγ), the cluster significance (S), the associated region index, the mean photon energy (〈E〉), the cluster classification type (e.g., Near Fermi, Bridged, Satellite, or None), and, when applicable, the angular separation from the nearest Fermi catalog source. Although the parameters Nγ, S, and 〈E〉 are not analyzed in detail within this work, they are included for completeness and to facilitate future studies. These quantities provide additional context for interpreting cluster properties and may help in subsequent analyses, such as assessing spectral characteristics, variability, or cross-identification with multiwavelength observations.
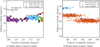 |
Fig. 2 Examples of special cluster morphologies. DBSCAN clusters are shown in different colors with black crosses marking centroids. 4FGL- DR4 sources with TS > 25 and TS < 25 are shown as red and blue circles, respectively. Panel a: fragmented extended source producing satellite clusters. Panel b: single DBSCAN cluster encompassing two nearby 4FGL-DR4 sources, a typical bridged case. |
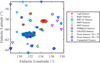 |
Fig. 3 Example slice from one of the 30 analyzed regions, showing a portion of Region 4 (South) after the third denoising step. The central source candidate, SIM06_J0112+0254, is clearly visible near the center of the image, while two additional sources associated with satellite clusters – SIM08_J0110+0149 and SIM08_J0107+0104 – appear in the lower left area. The central source remains detectable up to the sixth denoising step, whereas the two satellite clusters persist until the eighth step. |
5.3 Special clusters
5.3.1 Bridged clusters
In regions of elevated and spatially variable photon density- particularly near the Galactic plane-adjacent sources were sometimes not resolved as separate detections due to their proximity. As a result, multiple nearby sources were occasionally merged into a single extended cluster. Such cases, referred to as bridged clusters (Campana & Massaro 2021), occur when overlapping photon distributions prevent clean separation by density-based clustering. An example is shown in Figure 2.
To identify bridged clusters systematically, we examined a diagnostic region with a radius twice the cluster’s characteristic size, centered on its centroid. If two or more 4FGL-DR4 sources were located within this region, the cluster was flagged as a bridge (bridge). In some cases, blended structures can be disentangled by reapplying the denoising and clustering algorithms in a smaller (10° × 10°) field with adjusted parameters.
Mean photon count (〈Nγ〉i) and detection significance (〈S〉) for the four cluster categories.
5.3.2 Satellite clusters
Satellite clusters, first described by Campana et al. (2018), arise from the fragmentation of extended sources into multiple smaller clusters. These fragments are typically artifacts of the clustering process rather than genuine point sources. An example is shown in Figure 2.
Following the approach of Campana & Massaro (2021), we flagged pairs of clusters as satellites (sat) if their angular separation was less than the sum of their radii, increased by 10%. As with bridged clusters, a refined analysis in a smaller region with adjusted parameters often helps to recover the true underlying structure.
5.3.3 Near 4FGL-DR4 clusters
Clusters classified as Near 4FGL-DR4 (designated as NF, short for “Near Fermi” in the CDS catalog) lie just beyond the 0.15° matching radius from a known 4FGL-DR4 source but remain close enough that a possible association cannot be ruled out. Some of these clusters may represent the same underlying astrophysical source; however, since their separation exceeds the adopted threshold, definitive classification requires case-by-case evaluation through detailed spatial and spectral analysis.
5.4 Comparative properties of special cluster categories
We compared the average photon count and detection significance across four cluster categories: bridged clusters, satellite clusters, near-Fermi clusters, and new candidates, with results summarized in Table 4. Bridged clusters stand out with markedly higher values in both metrics, consistent with their interpretation as blends of multiple nearby sources that were not cleanly separated during clustering. This distinct profile justifies treating them as a separate class in subsequent source detection and modeling efforts.
By contrast, satellite and near-Fermi clusters show similar averages, suggesting that photon count and significance alone are insufficient to reliably distinguish between them. New candidate sources exhibit the lowest averages, appearing as fainter and less prominent clusters, which may indicate either intrinsically weak sources or limited photon statistics. These trends underscore the need for additional discriminative features in future classification schemes and for dedicated follow-up analyses to confirm the astrophysical nature of the new candidates.
6 Conclusion
In this study, we have presented a comprehensive catalog of gamma-ray source candidates derived from 16 years of Fermi- LAT data, focusing on the sky regions with |b| > 10°. By applying the SIMEFIC III denoising algorithm combined with the DBSCAN clustering method, we identified a total of 3112 candidate sources, significantly advancing our understanding of the high-energy gamma-ray sky. Among these, 370 candidates are previously unreported detections with no counterparts in existing catalogs, representing a rich set of potential astrophysical objects for further investigation.
We successfully associated 2822 of the detected sources with known entries in the 4FGL-DR4 catalog and established additional matches with other multiwavelength catalogs. These associations validate our methodology and demonstrate the effectiveness of our approach in revealing significant gamma-ray sources. Our results highlight the value of adaptive data analysis techniques, particularly in regions where a high source density complicates traditional detection methods.
This work not only contributes to ongoing cataloging efforts in high-energy astrophysics but also emphasizes the importance of follow-up observations of the newly identified candidates. These sources offer exciting opportunities for future research, especially in regions previously considered challenging due to strong gamma-ray emissions.
Data availability
The catalog table associated with this article is available at the CDS via https://cdsarc.cds.unistra.fr/viz-bin/cat/J/A+A/707/A61.
Acknowledgements
The authors thank the anonymous referee for constructive comments that helped improve the clarity and quality of this manuscript.
References
- Abdollahi, S., Acero, F., Baldini, L., et al. 2022, ApJS, 260, 53 [NASA ADS] [CrossRef] [Google Scholar]
- Ackermann, M., Ajello, M., Albert, A., et al. 2012, ApJS, 203, 4 [Google Scholar]
- Arsioli, B., Chang, Y.-L., & Musiimenta, B. 2020, MNRAS, 493, 2438 [NASA ADS] [CrossRef] [Google Scholar]
- Arsioli, B., Chang, Y.-L., & Ighina, L. 2025, MNRAS, 539, 1458 [Google Scholar]
- Atwood, W. B., et al. 2009, ApJ, 697, 1071 [NASA ADS] [CrossRef] [Google Scholar]
- Ballet, J., Bruel, P., Burnett, T. H., Lott, B., & Collaboration, T. F.-L. 2024, Fermi Large Area Telescope Fourth Source Catalog Data Release 4 (4FGL-DR4) [Google Scholar]
- Campana, R., & Massaro, E. 2021, A&A, 652, A6 [Google Scholar]
- Campana, R., Massaro, E., Gasparrini, D., et al. 2008, MNRAS, 383, 1166 [Google Scholar]
- Campana, R., Massaro, E., & Bernieri, E. 2018, A&A, 619, A23 [NASA ADS] [CrossRef] [EDP Sciences] [Google Scholar]
- Campana, R., Massaro, E., Bocchino, F., et al. 2022, MNRAS, 515, 1676 [Google Scholar]
- Chang, Y.-L., Arsioli, B., Giommi, P., & Padovani, P. 2017, A&A, 598, A17 [NASA ADS] [CrossRef] [EDP Sciences] [Google Scholar]
- Chang, Y.-L., Arsioli, B., Giommi, P., et al. 2019, A&A, 632, A77 [NASA ADS] [CrossRef] [EDP Sciences] [Google Scholar]
- D’Abrusco, R., Massaro, F., Paggi, A., et al. 2014, ApJS, 215, 14 [Google Scholar]
- Ester, M., Kriegel, H.-P., Sander, J., & Xu, X. 1996, KDD, 96, 226 [Google Scholar]
- Healey, S. E., Romani, R. W., Taylor, G. B., et al. 2007, ApJS, 171, 61 [Google Scholar]
- Hedayati Kh. H., Soor, M., & Akhondi, F. 2024, ApJ, 968, 37 [Google Scholar]
- Kanbach, G., et al. 1989, Space Sci. Rev., 49, 69 [Google Scholar]
- Li, T., & Ma, Y. 1983, ApJ, 272, 317 [CrossRef] [Google Scholar]
- Massaro, E., Maselli, A., Leto, C., et al. 2015, Ap&SS, 357, 1 [Google Scholar]
- Mattox, J. R., et al. 1996, ApJ, 461, 396 [NASA ADS] [CrossRef] [Google Scholar]
- SLAC National Accelerator Laboratory. n.d., Fermi-LAT Performance, https://www.slac.stanford.edu/exp/glast/groups/canda/lat_Performance.htm, accessed: 2025-08-16 [Google Scholar]
- Soor, M., Akhondi, F., & Hedayati Kh, H. 2025, MNRAS, 537, 730 [Google Scholar]
- Starck, J.-L., Fadili, J. M., Digel, S., et al. 2009, A&A, 504, 641 [NASA ADS] [CrossRef] [EDP Sciences] [Google Scholar]
- Tramacere, A., & Vecchio, C. 2013, A&A, 549, A138 [NASA ADS] [CrossRef] [EDP Sciences] [Google Scholar]
- Wakely, S. P., & Horan, D. 2008, ICRC, 3, 1341 [Google Scholar]
All Tables
Mean photon count (〈Nγ〉i) and detection significance (〈S〉) for the four cluster categories.
All Figures
|
Fig. 1 Photon count map showing the 30 overlapping analysis regions, based on the 9Y-MST tiling scheme with additional fields added near the Galactic plane (10° < |b| < 20°). Each region overlaps adjacent fields by 2° to reduce edge effects during source detection. The inner Galactic plane (|b| ≤ 10°) is excluded from the analysis due to intense diffuse gamma-ray emission. DBSCAN clusters are denoted by blue circles |
| In the text | |
|
Fig. 2 Examples of special cluster morphologies. DBSCAN clusters are shown in different colors with black crosses marking centroids. 4FGL- DR4 sources with TS > 25 and TS < 25 are shown as red and blue circles, respectively. Panel a: fragmented extended source producing satellite clusters. Panel b: single DBSCAN cluster encompassing two nearby 4FGL-DR4 sources, a typical bridged case. |
| In the text | |
|
Fig. 3 Example slice from one of the 30 analyzed regions, showing a portion of Region 4 (South) after the third denoising step. The central source candidate, SIM06_J0112+0254, is clearly visible near the center of the image, while two additional sources associated with satellite clusters – SIM08_J0110+0149 and SIM08_J0107+0104 – appear in the lower left area. The central source remains detectable up to the sixth denoising step, whereas the two satellite clusters persist until the eighth step. |
| In the text | |
Current usage metrics show cumulative count of Article Views (full-text article views including HTML views, PDF and ePub downloads, according to the available data) and Abstracts Views on Vision4Press platform.
Data correspond to usage on the plateform after 2015. The current usage metrics is available 48-96 hours after online publication and is updated daily on week days.
Initial download of the metrics may take a while.