Fig. 2
Download original image
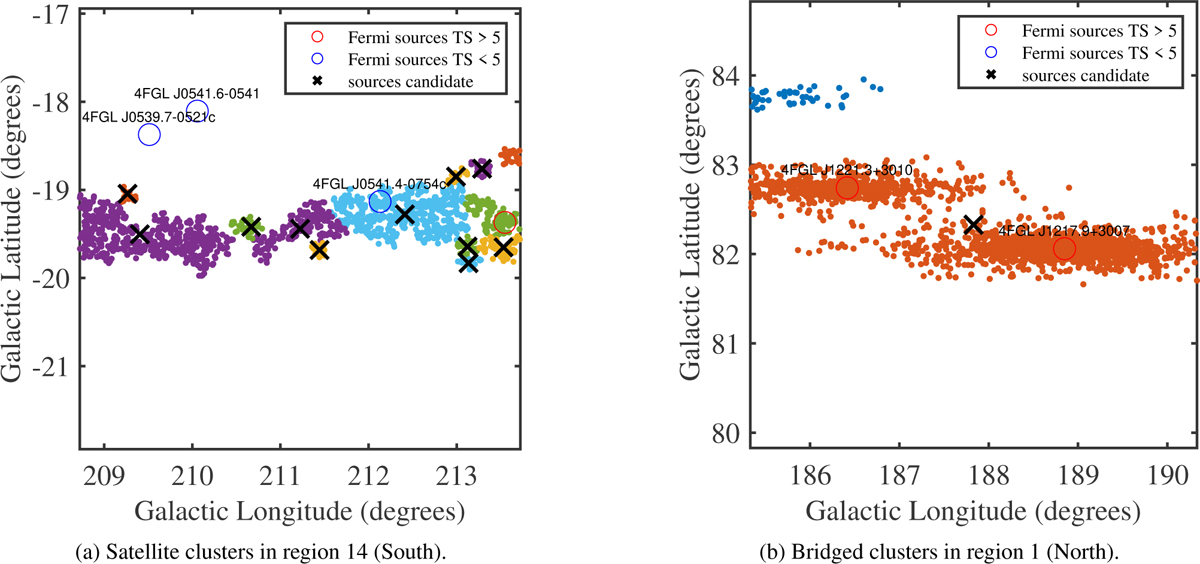
Examples of special cluster morphologies. DBSCAN clusters are shown in different colors with black crosses marking centroids. 4FGL- DR4 sources with TS > 25 and TS < 25 are shown as red and blue circles, respectively. Panel a: fragmented extended source producing satellite clusters. Panel b: single DBSCAN cluster encompassing two nearby 4FGL-DR4 sources, a typical bridged case.
Current usage metrics show cumulative count of Article Views (full-text article views including HTML views, PDF and ePub downloads, according to the available data) and Abstracts Views on Vision4Press platform.
Data correspond to usage on the plateform after 2015. The current usage metrics is available 48-96 hours after online publication and is updated daily on week days.
Initial download of the metrics may take a while.