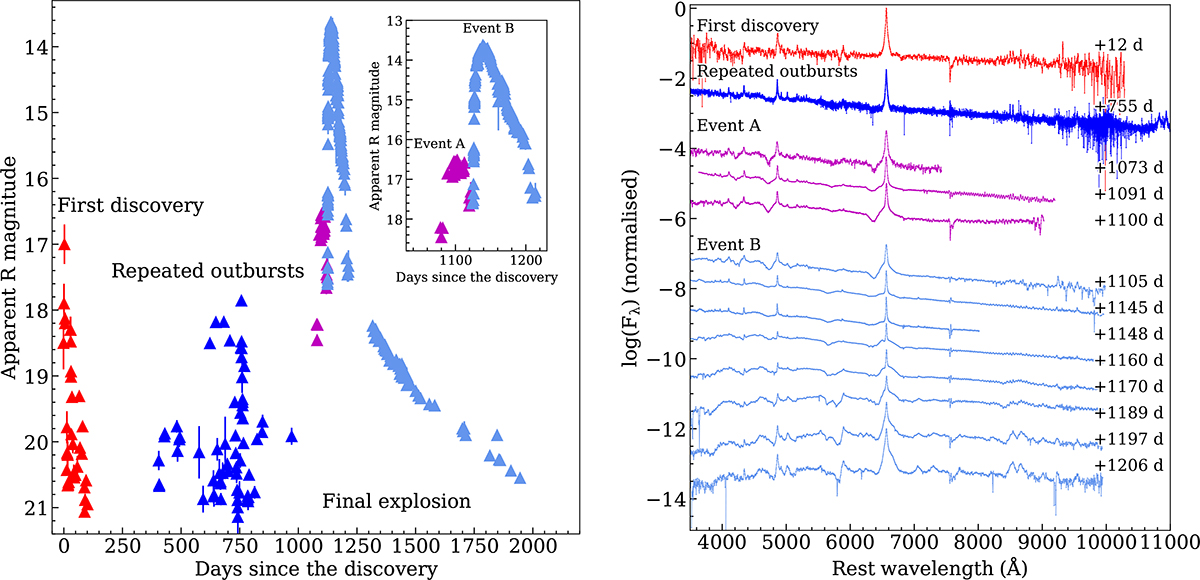
Fig. 1.
Download original image
Light curve and spectra of SN 2009ip. Left: Annotated R light curve showing the first outburst that marked the discovery of the transient in 2009, repeated outbursts during 2010 and 2011, and the main event in 2012. The inset zooms in on the latter, highlighting the presence of Events A and B. Different colours indicate the various light curve phases. Adapted from Pastorello et al. (2013). Data from Maza et al. (2009), Smith et al. (2010), Foley et al. (2011), Mauerhan et al. (2013), Fraser et al. (2013), Pastorello et al. (2013), Prieto et al. (2013), Margutti et al. (2014). Right: Selected spectra of SN 2009ip for key light curve phases (first discovery, repeated outbursts, Event A, and Event B). Numbers next to the spectra are computed from the epoch of first discovery. Data from Pastorello et al. (2013), Fraser et al. (2013).
Current usage metrics show cumulative count of Article Views (full-text article views including HTML views, PDF and ePub downloads, according to the available data) and Abstracts Views on Vision4Press platform.
Data correspond to usage on the plateform after 2015. The current usage metrics is available 48-96 hours after online publication and is updated daily on week days.
Initial download of the metrics may take a while.