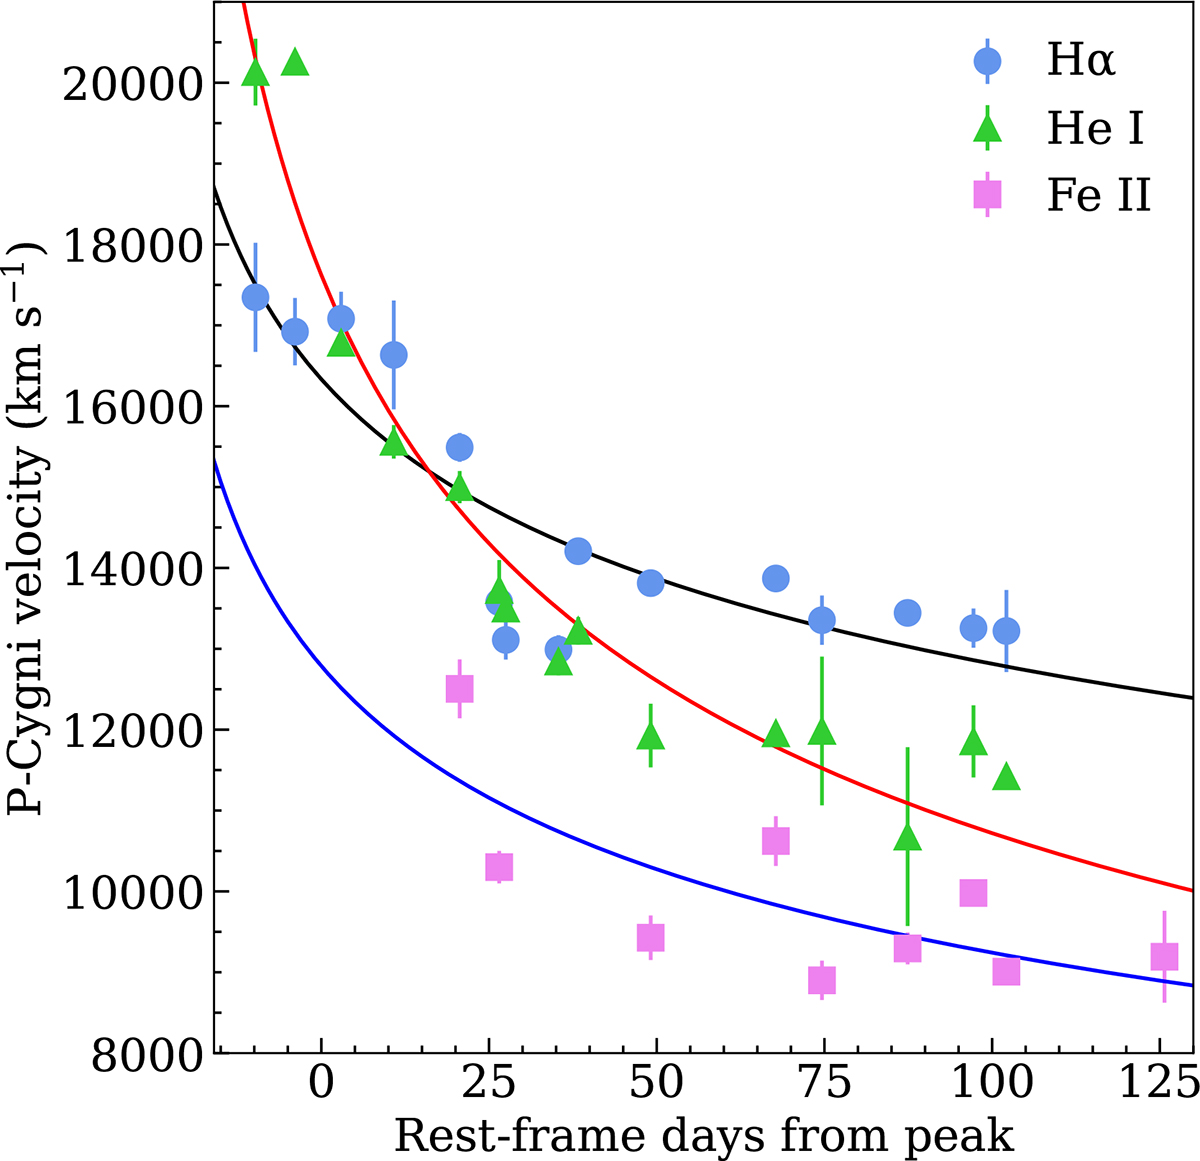
Fig. 10.
Download original image
Expansion velocity measured from the minimum of the broad P-Cygni for Hα, He Iλ5876, and Fe IIλ5169, together with the corresponding power-law fits (black, red, and blue lines, respectively). A similar double trend is seen for Hα before and after phase +30 days, while He I follows a power-law decline, although, it is contaminated by Na I D, especially at late phases. The Fe II line also shows a power-law decline, albeit with some scatter, possibly due to the difficult identification.
Current usage metrics show cumulative count of Article Views (full-text article views including HTML views, PDF and ePub downloads, according to the available data) and Abstracts Views on Vision4Press platform.
Data correspond to usage on the plateform after 2015. The current usage metrics is available 48-96 hours after online publication and is updated daily on week days.
Initial download of the metrics may take a while.