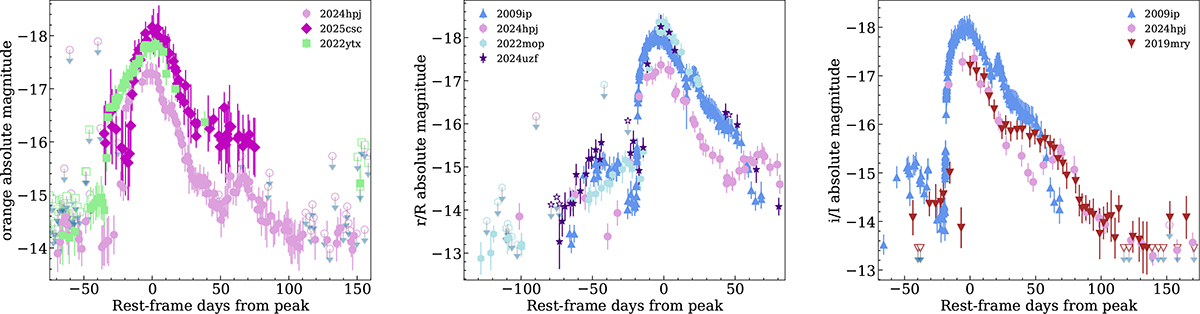
Fig. 11.
Download original image
Light curves of objects observed in our sample. Each SN is shown in the best-sampled broadband light curve. Comparisons with SN 2024hpj and, when available, SN 2009ip, are also included. Phases are calculated from the Event B peak. The luminosity at this peak and the subsequent decline rate are very similar, whereas there is some variation in the duration and brightness of Event A. Arrows and open symbols indicate upper limits.
Current usage metrics show cumulative count of Article Views (full-text article views including HTML views, PDF and ePub downloads, according to the available data) and Abstracts Views on Vision4Press platform.
Data correspond to usage on the plateform after 2015. The current usage metrics is available 48-96 hours after online publication and is updated daily on week days.
Initial download of the metrics may take a while.