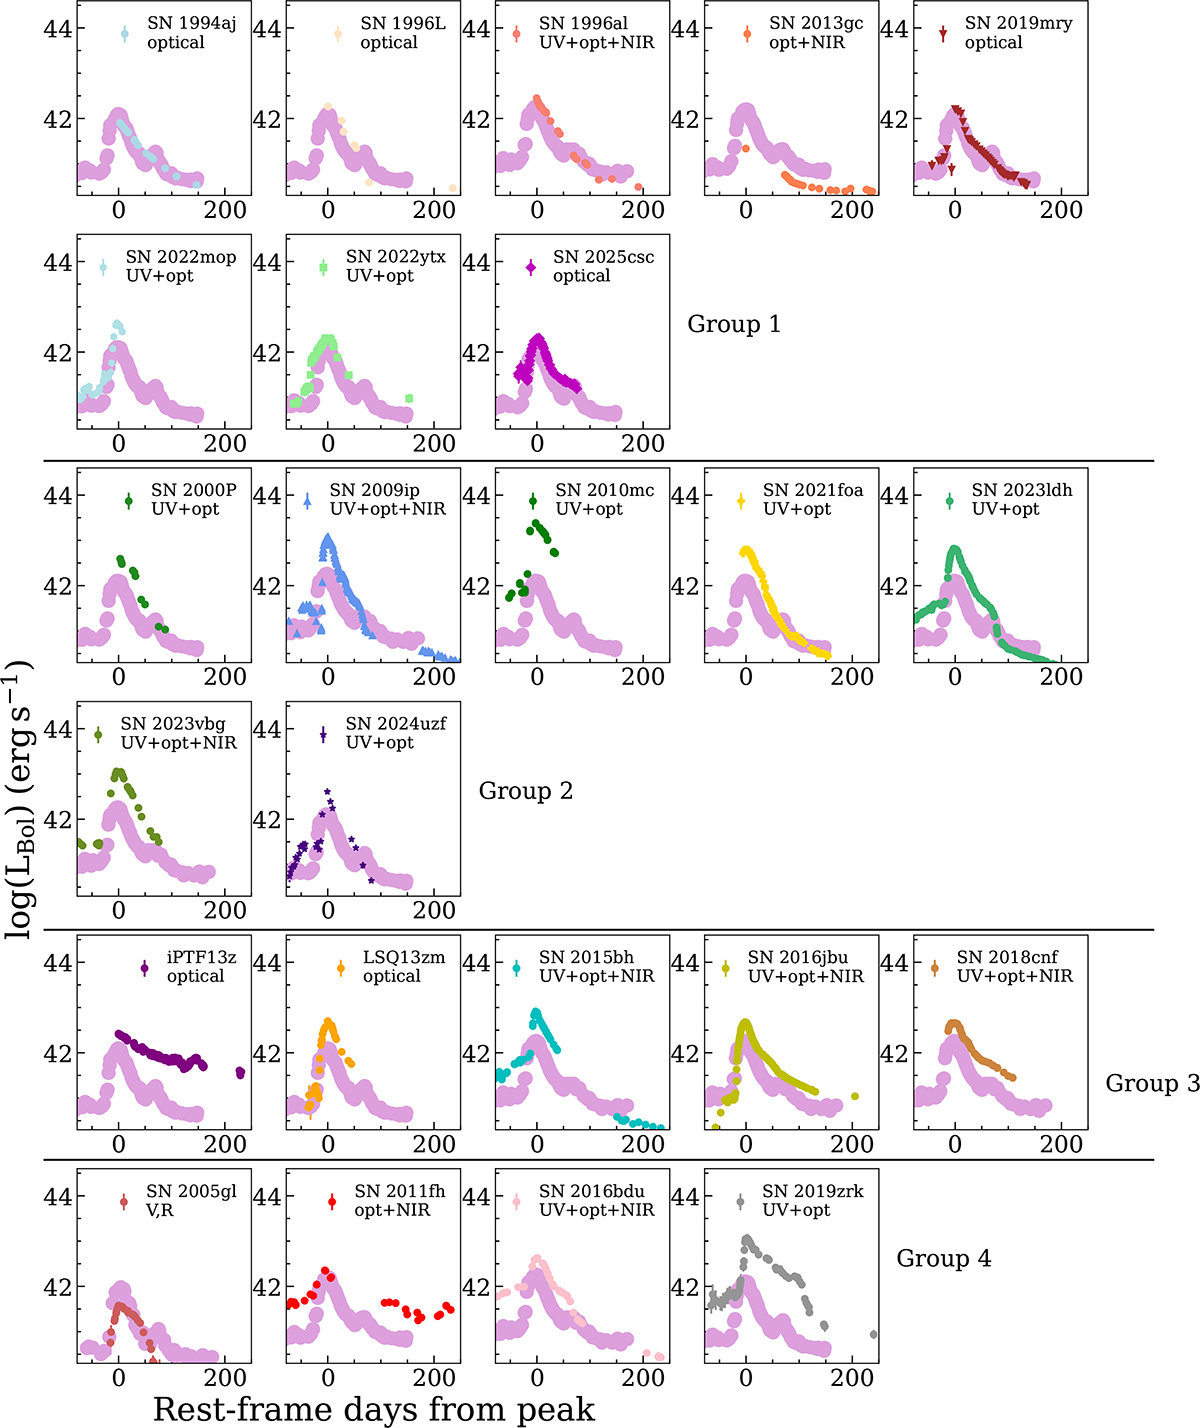
Fig. 13.
Download original image
Individual pseudo-bolometric light curve of SN 2024hpj (mauve points) compared with the sample SNe. All light curves are matched at the Event B peak (for SN 2022mop, only the 2024–2025 period is shown). Labels indicate the bands used to build the light curve (see text). Four groups are discernible: rise and/or decay time and peak luminosity similar to SN 2024hpj (group 1); more luminous and/or faster declining than SN 2024hpj (group 2); slower declining than SN 2024hpj (group 3); and exhibiting a plateau (group 4).
Current usage metrics show cumulative count of Article Views (full-text article views including HTML views, PDF and ePub downloads, according to the available data) and Abstracts Views on Vision4Press platform.
Data correspond to usage on the plateform after 2015. The current usage metrics is available 48-96 hours after online publication and is updated daily on week days.
Initial download of the metrics may take a while.