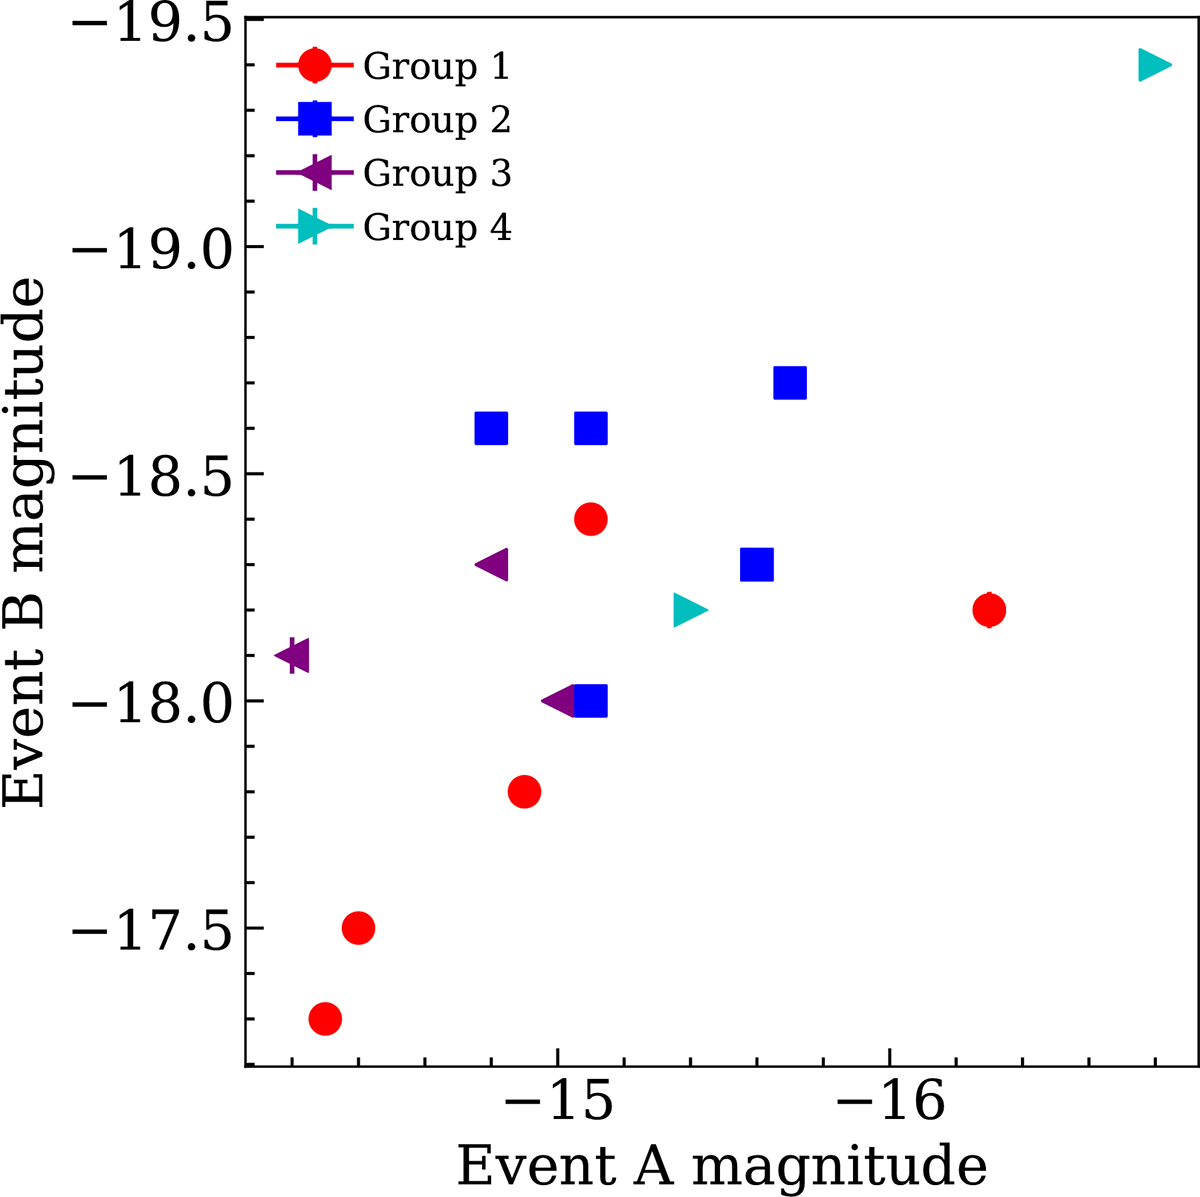
Fig. 14.
Download original image
Magnitude at the Event B peak as a function of the magnitude at the Event A peak. Measurements were performed in the r and R bands when available. For SNe not covered during Event A in r (SNe 2025csc, 2022ytx, and 2019mry), we performed the measurements in the orange band for SNe 2025csc and 2022ytx, and in the I band for SN 2019mry. Colours are the same as in Fig. 13. Error bars are present but often smaller than the data points.
Current usage metrics show cumulative count of Article Views (full-text article views including HTML views, PDF and ePub downloads, according to the available data) and Abstracts Views on Vision4Press platform.
Data correspond to usage on the plateform after 2015. The current usage metrics is available 48-96 hours after online publication and is updated daily on week days.
Initial download of the metrics may take a while.