Fig. 15.
Download original image
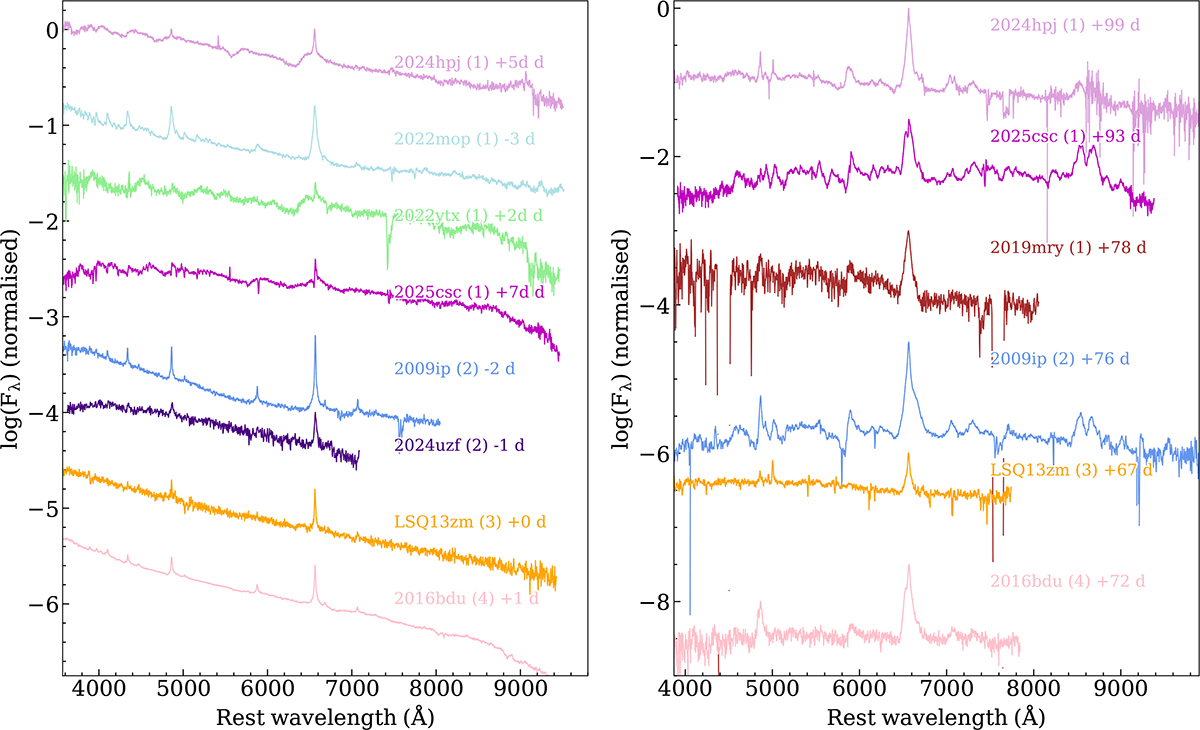
Spectral comparison of SN 2024hpj with selected SNe from the sample. Left: Comparison around the Event B peak. Right: Comparison approximately 100 days after the Event B peak. Numbers in parentheses indicate the group based on the light curve (see text). Phases from the Event B maximum are also reported. All spectra are redshift- and reddening-corrected.
Current usage metrics show cumulative count of Article Views (full-text article views including HTML views, PDF and ePub downloads, according to the available data) and Abstracts Views on Vision4Press platform.
Data correspond to usage on the plateform after 2015. The current usage metrics is available 48-96 hours after online publication and is updated daily on week days.
Initial download of the metrics may take a while.