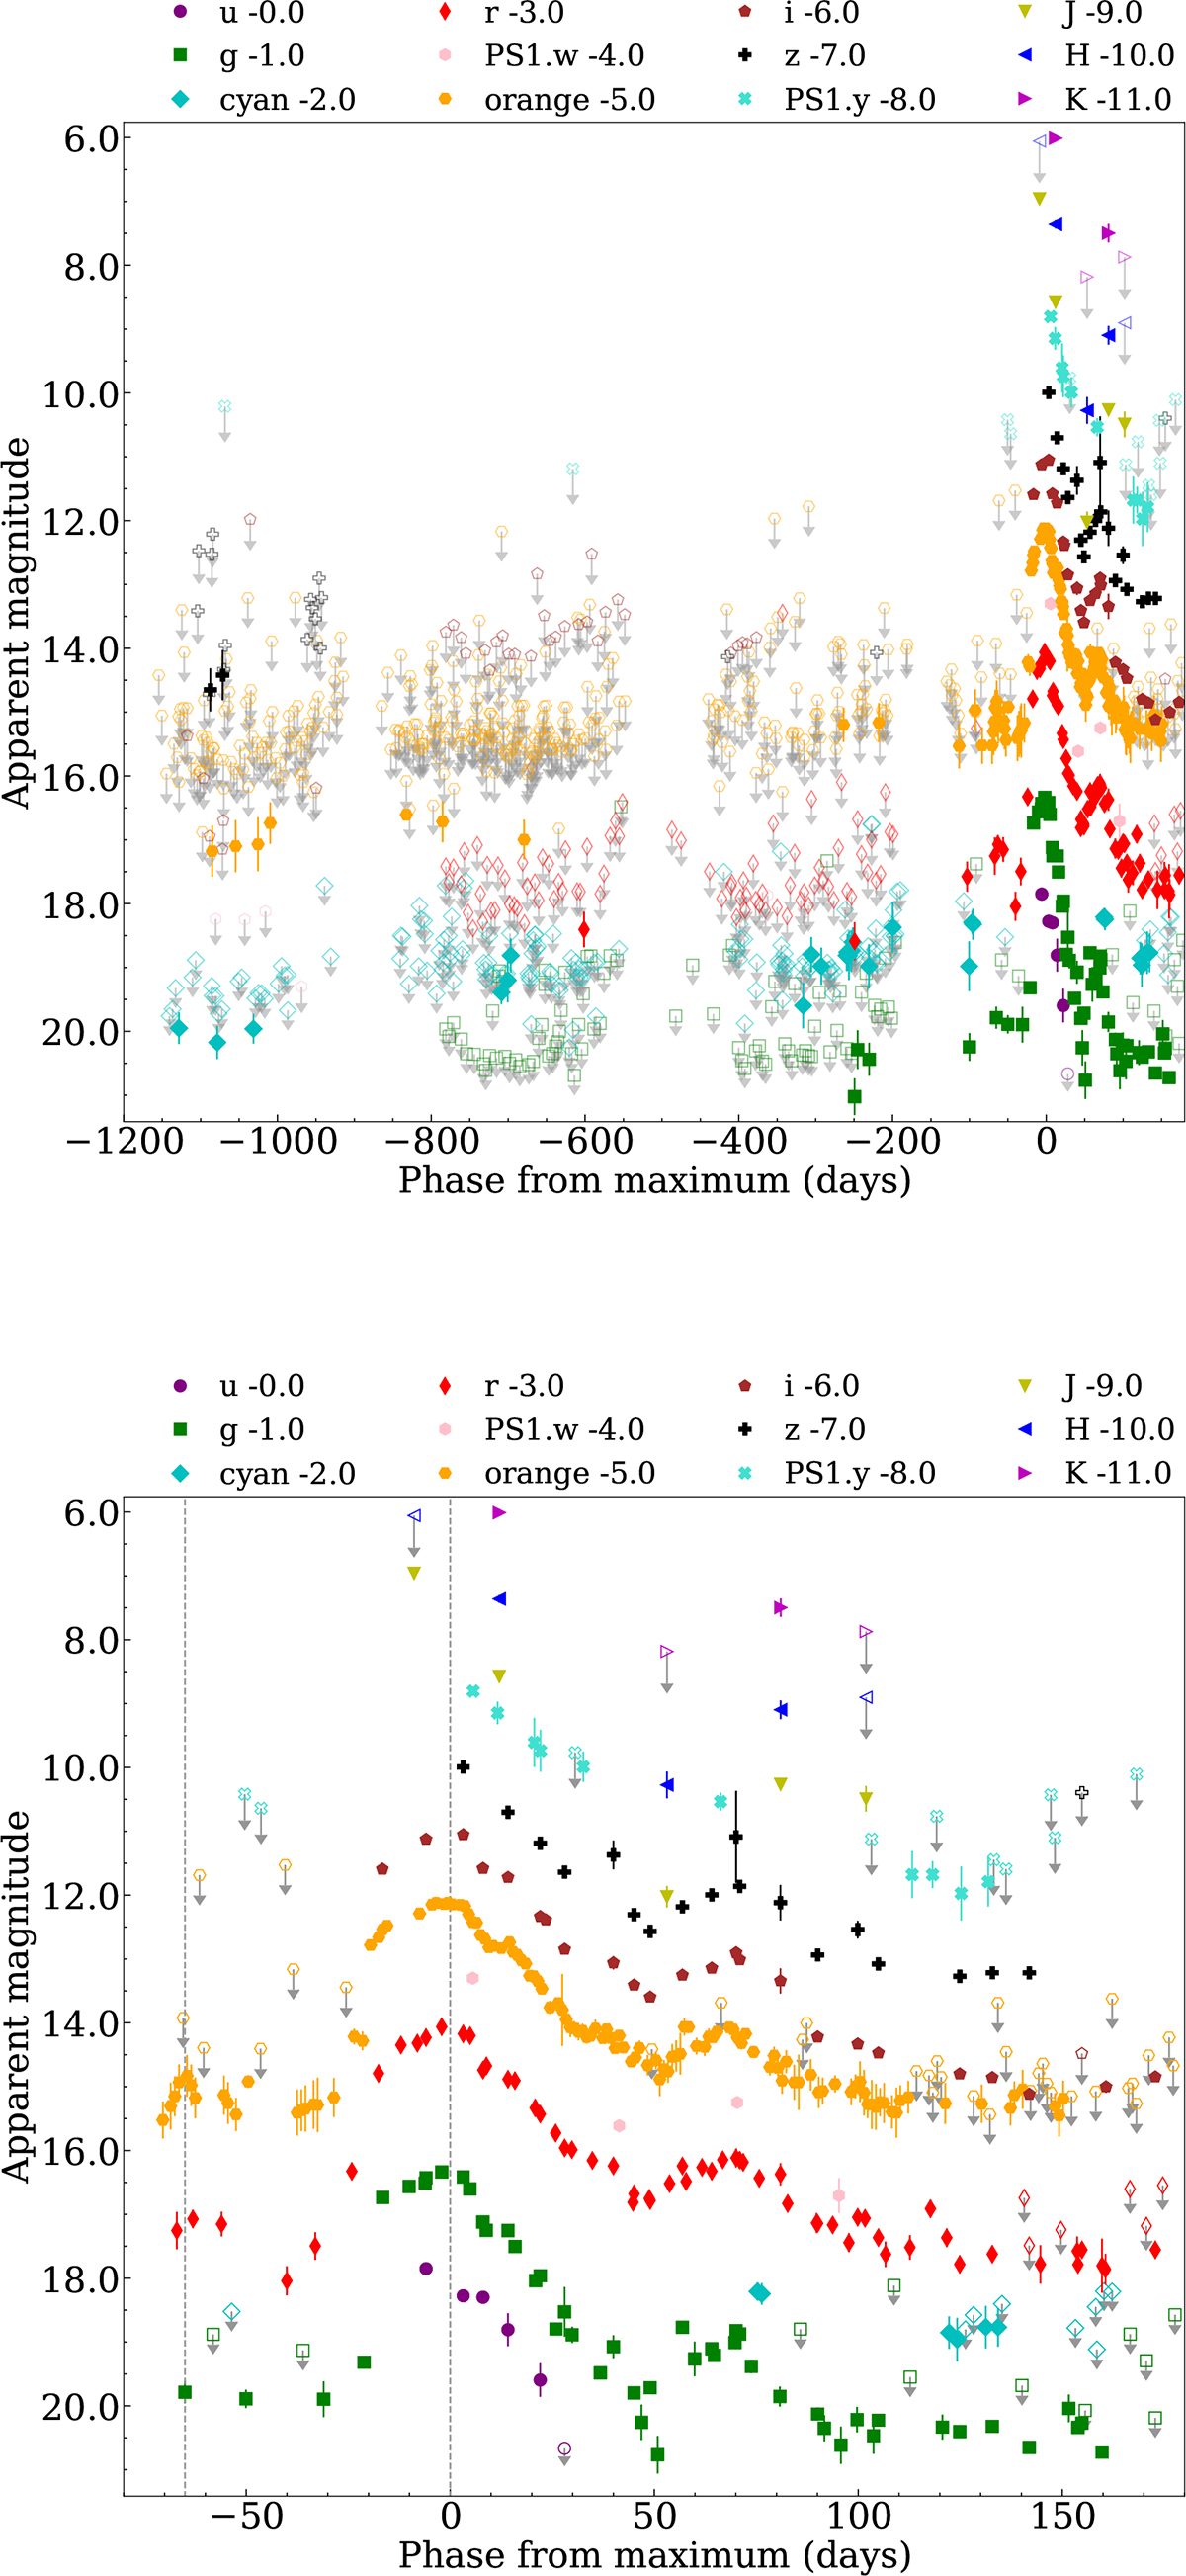
Fig. 3.
Download original image
Apparent light curve of SN 2024hpj in the u, g, r, i, z, J, H, K, cyan, orange, w, and y bands. A rigid shift is applied for better visualisation. Top: Complete light curve covering the last ∼3 years. Bottom: Zoom-in on the Event A+B light curve. Dashed grey lines indicate the peaks of Events A and B, while grey arrows and open symbols indicate upper limits. Phases are calculated with respect to the epoch of the Event B maximum (MJD 60455).
Current usage metrics show cumulative count of Article Views (full-text article views including HTML views, PDF and ePub downloads, according to the available data) and Abstracts Views on Vision4Press platform.
Data correspond to usage on the plateform after 2015. The current usage metrics is available 48-96 hours after online publication and is updated daily on week days.
Initial download of the metrics may take a while.