Open Access
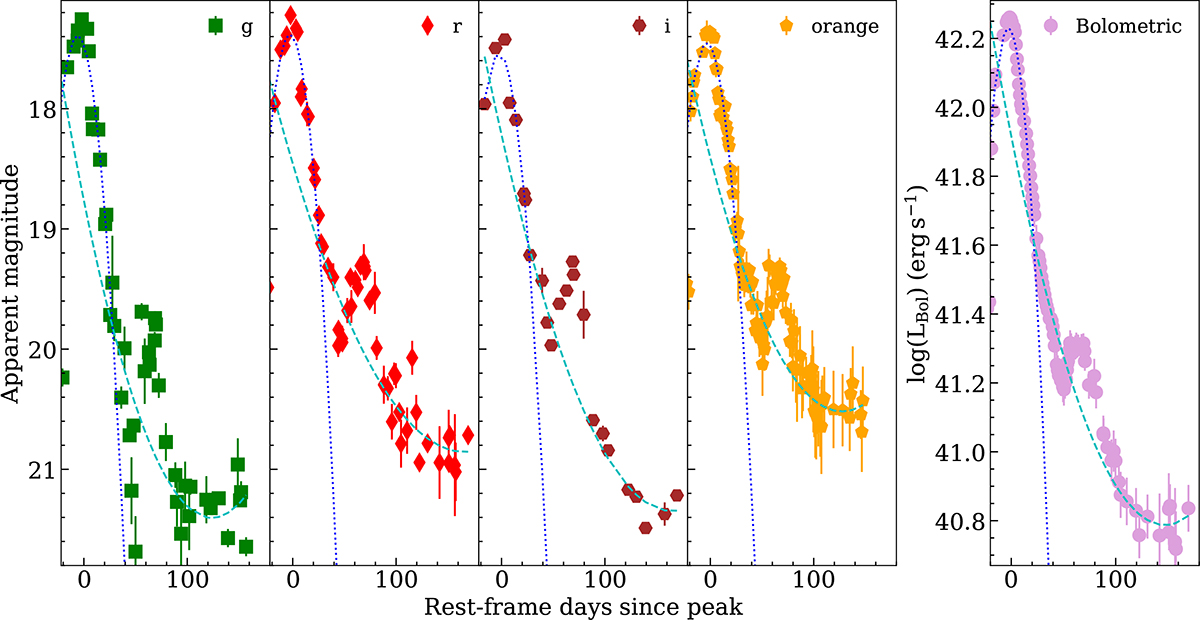
Fig. 6.
Download original image
Fit of the peak (dotted blue line) and decline (dashed cyan line) of the multiband (g, r, i and orange) and pseudo-bolometric light curves. The secondary bump is excluded from the fit (see text).
Current usage metrics show cumulative count of Article Views (full-text article views including HTML views, PDF and ePub downloads, according to the available data) and Abstracts Views on Vision4Press platform.
Data correspond to usage on the plateform after 2015. The current usage metrics is available 48-96 hours after online publication and is updated daily on week days.
Initial download of the metrics may take a while.