Open Access
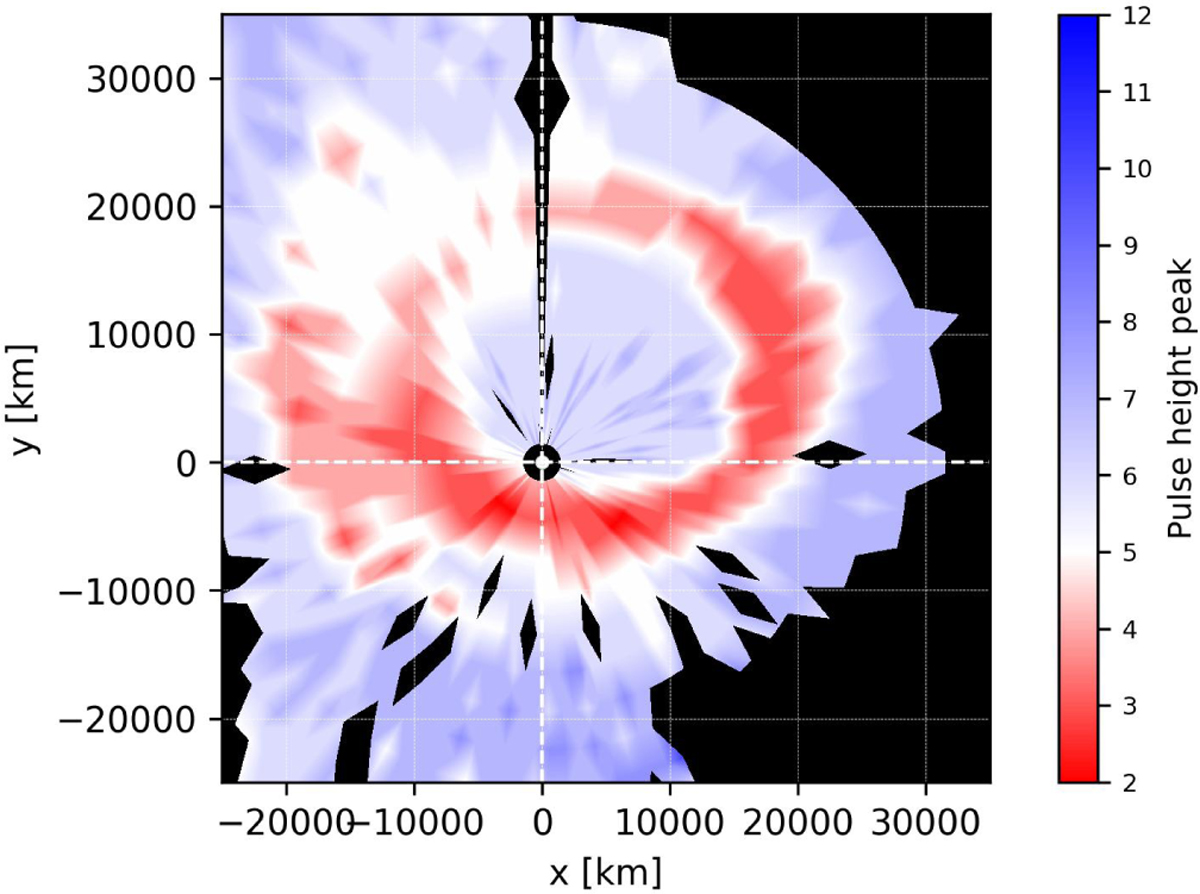
Fig. A.1
Download original image
PHD peak map for the 125-130 nm interval during the whole duration of PJ6. Regions where the PHD peak falls below the nominal threshold of 5 are indicative of detector nonlinearity or calibration degradation. These pixels are considered unreliable for accurate spectral analysis.
Current usage metrics show cumulative count of Article Views (full-text article views including HTML views, PDF and ePub downloads, according to the available data) and Abstracts Views on Vision4Press platform.
Data correspond to usage on the plateform after 2015. The current usage metrics is available 48-96 hours after online publication and is updated daily on week days.
Initial download of the metrics may take a while.