Open Access
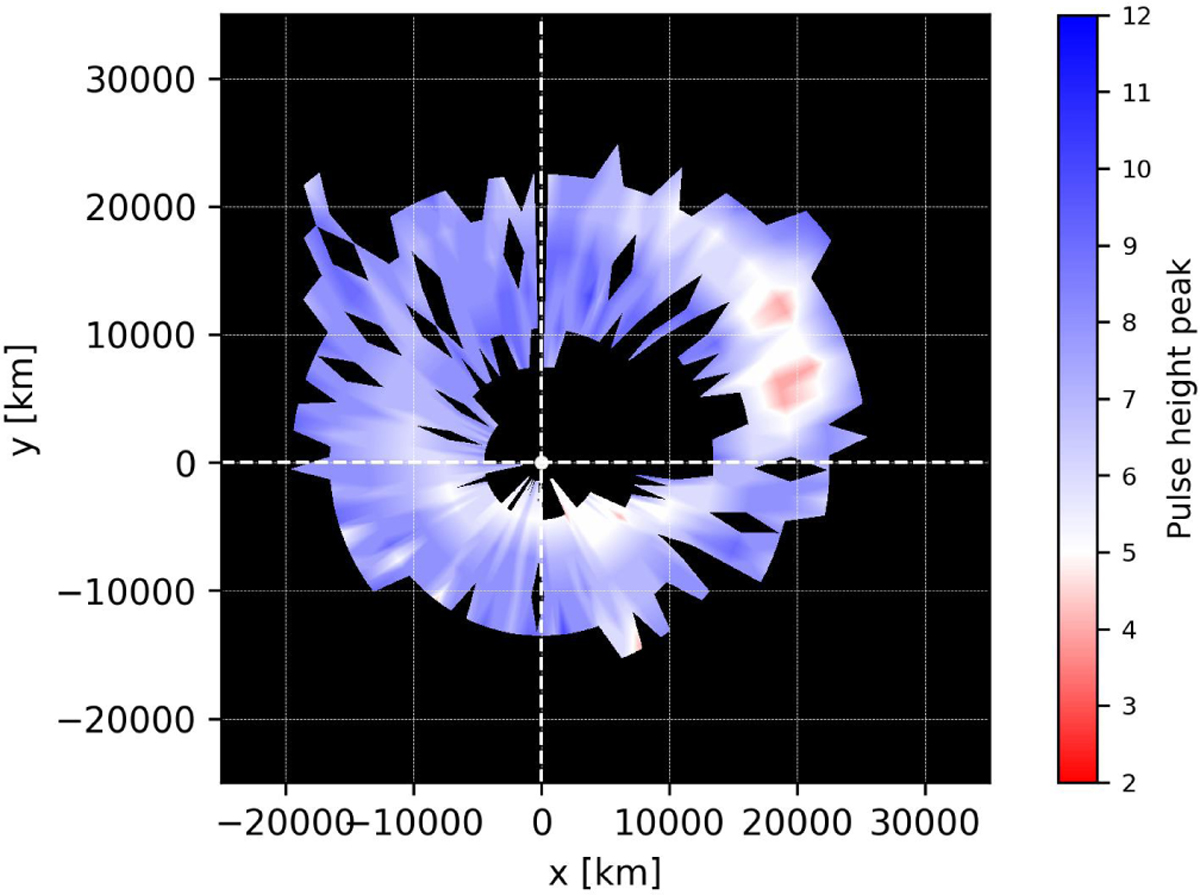
Fig. A.3
Download original image
PHD peak map for the 135-140 nm interval during the whole duration of PJ6. Most regions exhibit PHD peaks above the calibration threshold, indicating reliable spectral response.
Current usage metrics show cumulative count of Article Views (full-text article views including HTML views, PDF and ePub downloads, according to the available data) and Abstracts Views on Vision4Press platform.
Data correspond to usage on the plateform after 2015. The current usage metrics is available 48-96 hours after online publication and is updated daily on week days.
Initial download of the metrics may take a while.