Open Access
Fig. B.4
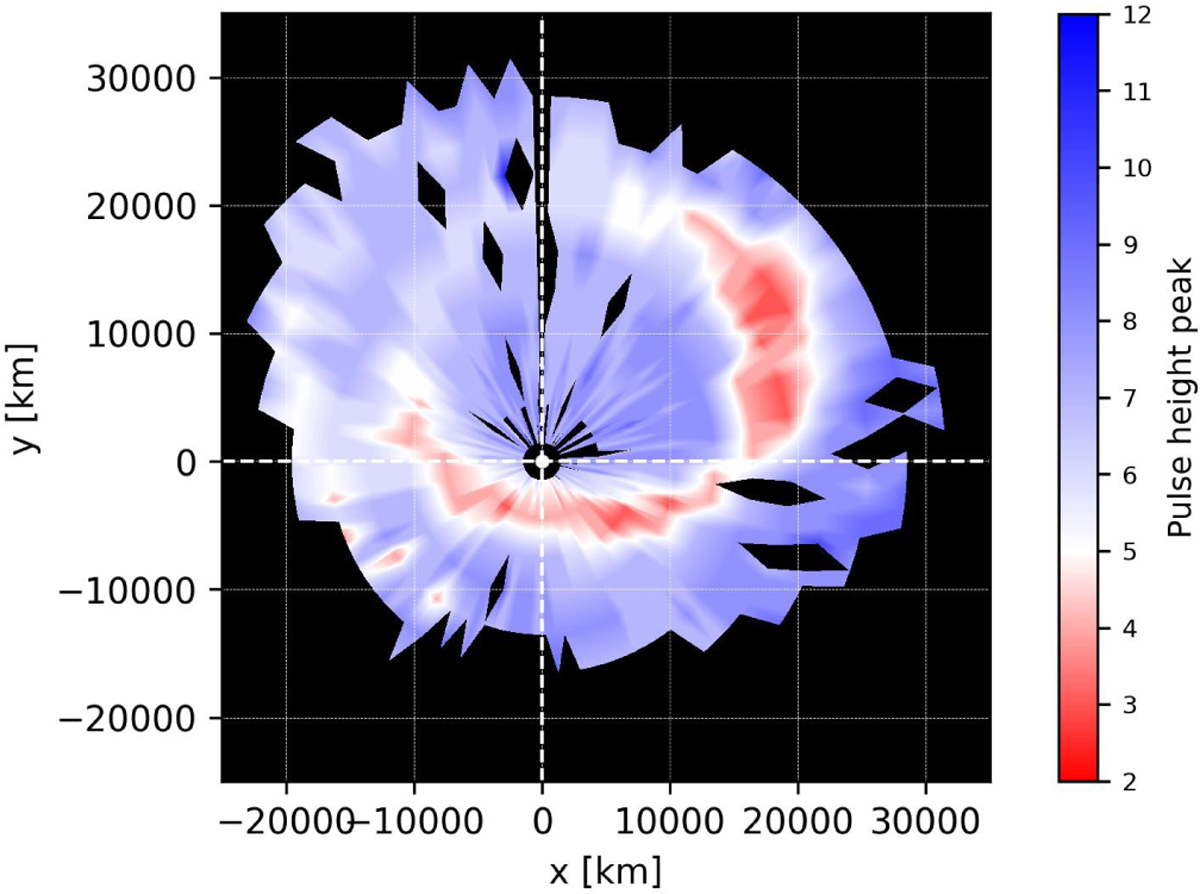
Download original image
PHD peak values in the 155-162 nm band during the whole duration of PJ6. Regions with values below 5 (pink patches) are indicative of high flux and probable detector nonlinearity, particularly within the brightest parts of the aurora.
Current usage metrics show cumulative count of Article Views (full-text article views including HTML views, PDF and ePub downloads, according to the available data) and Abstracts Views on Vision4Press platform.
Data correspond to usage on the plateform after 2015. The current usage metrics is available 48-96 hours after online publication and is updated daily on week days.
Initial download of the metrics may take a while.