Fig. 2
Download original image
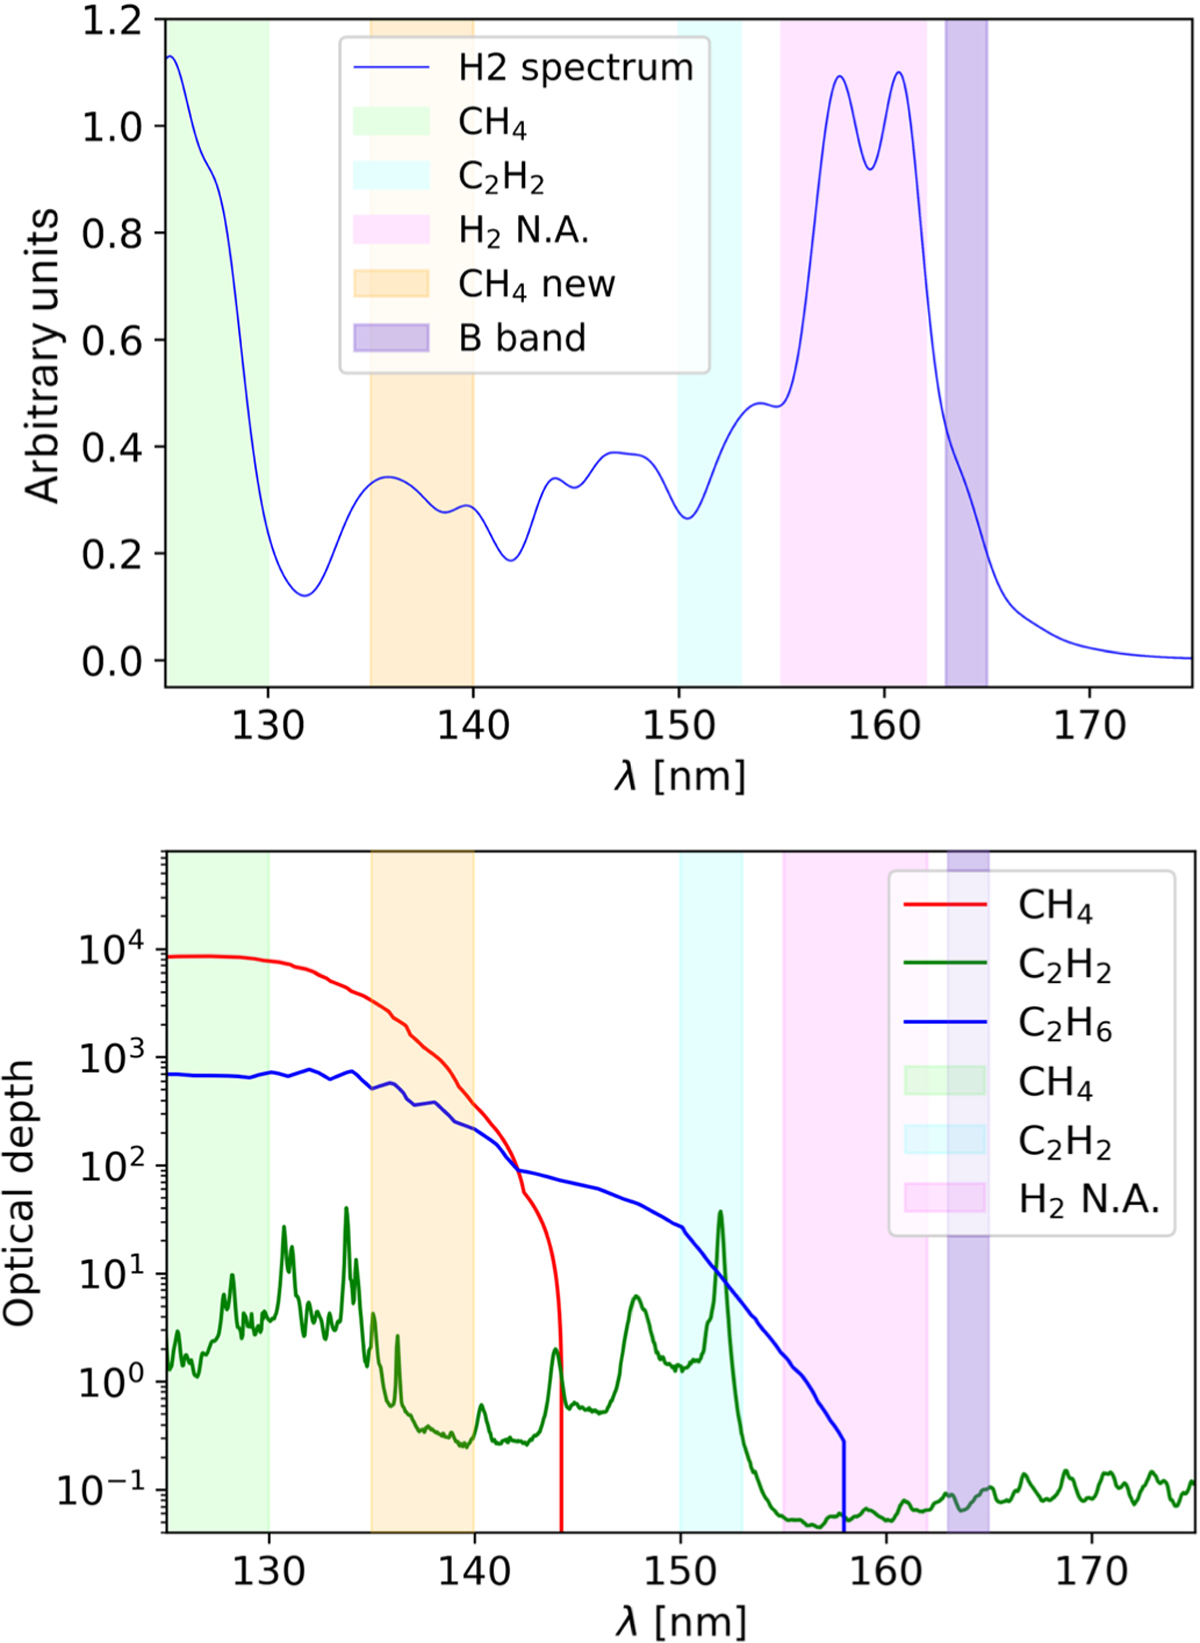
Spectral diagnostics for hydrocarbon absorption and CR computation. Transparent green and cyan bands indicate the absorption spectral ranges used for CR calculations (125-130 nm for CH4, 150153 nm for C2H2), while the magenta band represents the nonabsorbed region assumed to be free of hydrocarbon absorption. The orange band is the new spectral range proposed for absorption of CH4 and the purple one is used to scale the color ratio in case of detector nonlinearity in the unabsorbed band (see Sect. 3.3). Upper panel: Simulated unabsorbed H2 spectrum from TransPlanet in dark blue. Lower panel: Corresponding optical depth for CH4, C2H2, and C2H6, showing the ranges used in CR calculations (from Benmahi et al. 2024a).
Current usage metrics show cumulative count of Article Views (full-text article views including HTML views, PDF and ePub downloads, according to the available data) and Abstracts Views on Vision4Press platform.
Data correspond to usage on the plateform after 2015. The current usage metrics is available 48-96 hours after online publication and is updated daily on week days.
Initial download of the metrics may take a while.