Fig. 3
Download original image
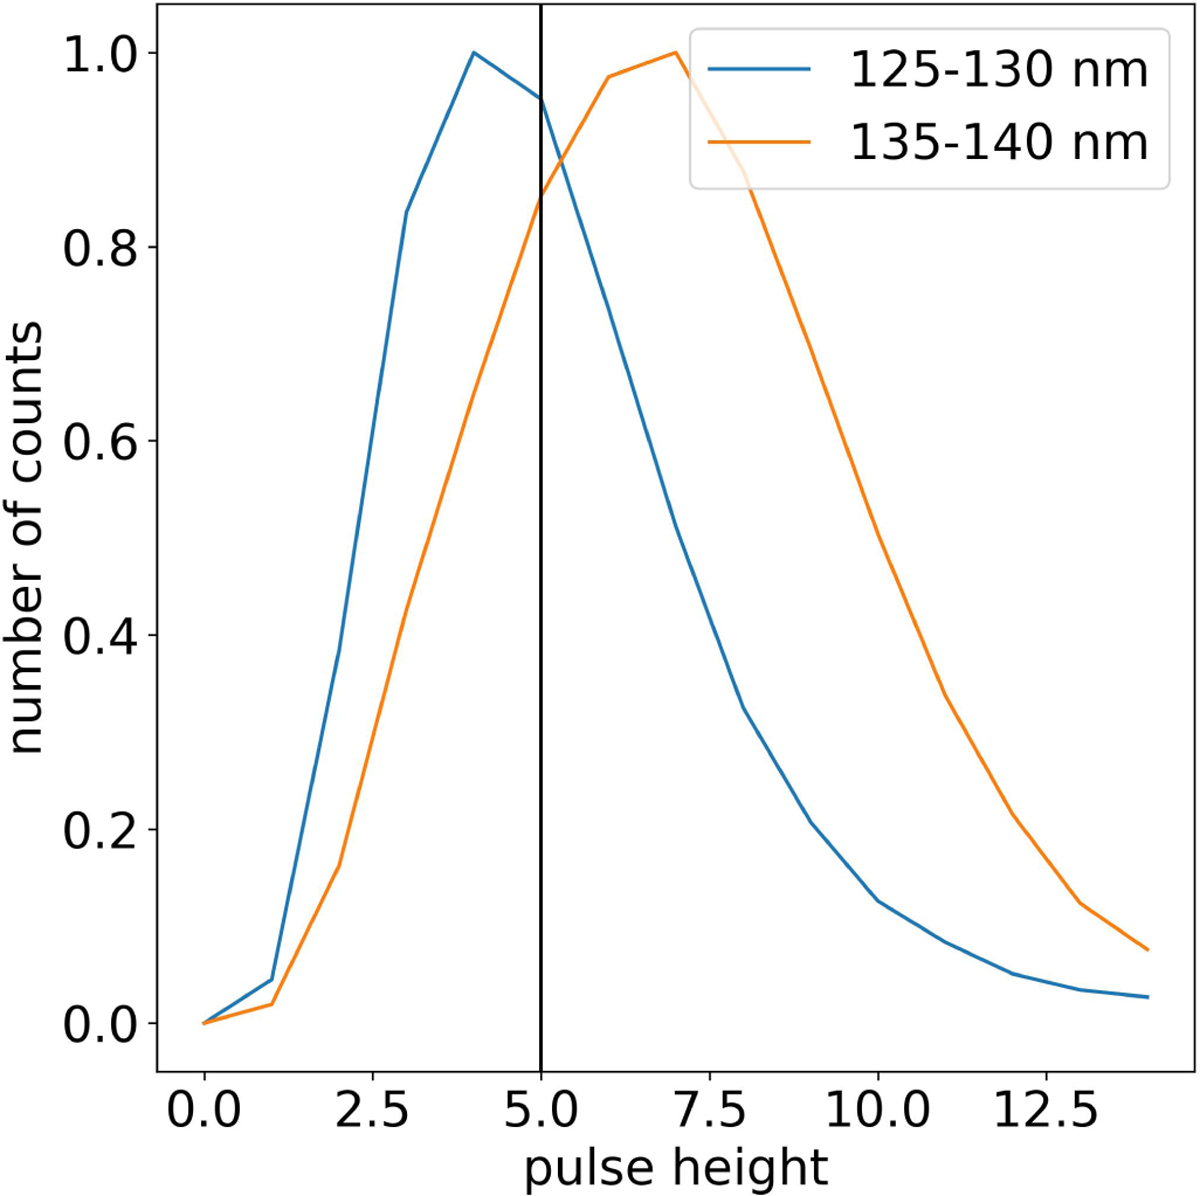
Comparison of normalized PHDs in the 125-130 nm spectral band (blue) and the 135-140 nm spectral band (orange) during PJ10 for the region between 70°S and 73°S and between 30°W and 60°W. The orange histogram (135-140 nm) shows a well-calibrated distribution with a peak above 5. The blue histogram (125-130 nm) shows a PHD with a degraded shape and a peak below 5, indicating significant signal loss.
Current usage metrics show cumulative count of Article Views (full-text article views including HTML views, PDF and ePub downloads, according to the available data) and Abstracts Views on Vision4Press platform.
Data correspond to usage on the plateform after 2015. The current usage metrics is available 48-96 hours after online publication and is updated daily on week days.
Initial download of the metrics may take a while.