Fig. 7
Download original image
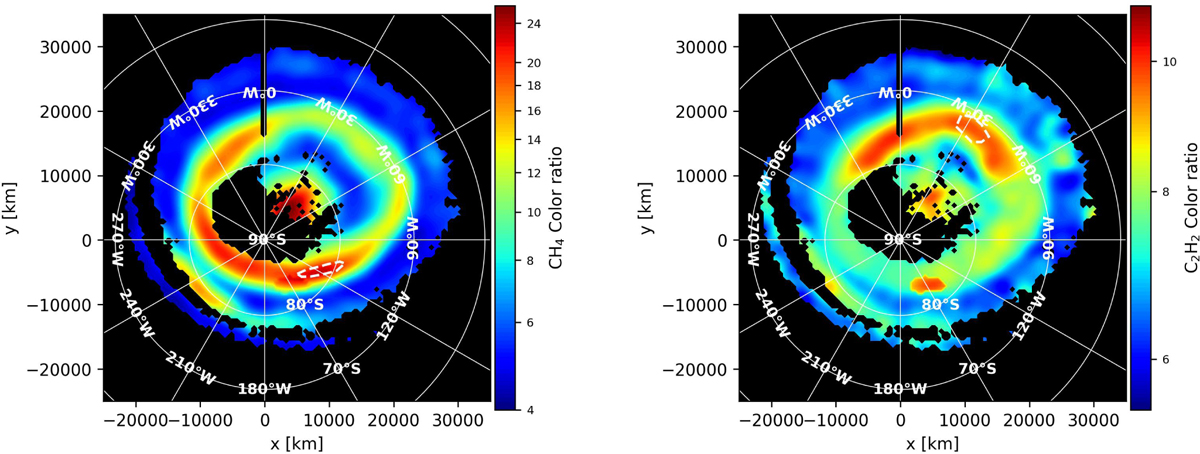
CR maps for PJ10 in the southern auroral region after applying the corrections presented in Sect. 3.3. Right panel: CR map for CH4. Left panel: CR map for C2H2 The corrected regions are highlighted in Fig. 8. A region centered near 85°S, 180°W exhibits strong CH4 absorption but weak C2H2 absorption, while an opposite pattern (low CH4 and enhanced C2H2 absorption) is observed around 70°S, 30°W. Dashed white polygons outline regions with contrasting CR behaviors.
Current usage metrics show cumulative count of Article Views (full-text article views including HTML views, PDF and ePub downloads, according to the available data) and Abstracts Views on Vision4Press platform.
Data correspond to usage on the plateform after 2015. The current usage metrics is available 48-96 hours after online publication and is updated daily on week days.
Initial download of the metrics may take a while.