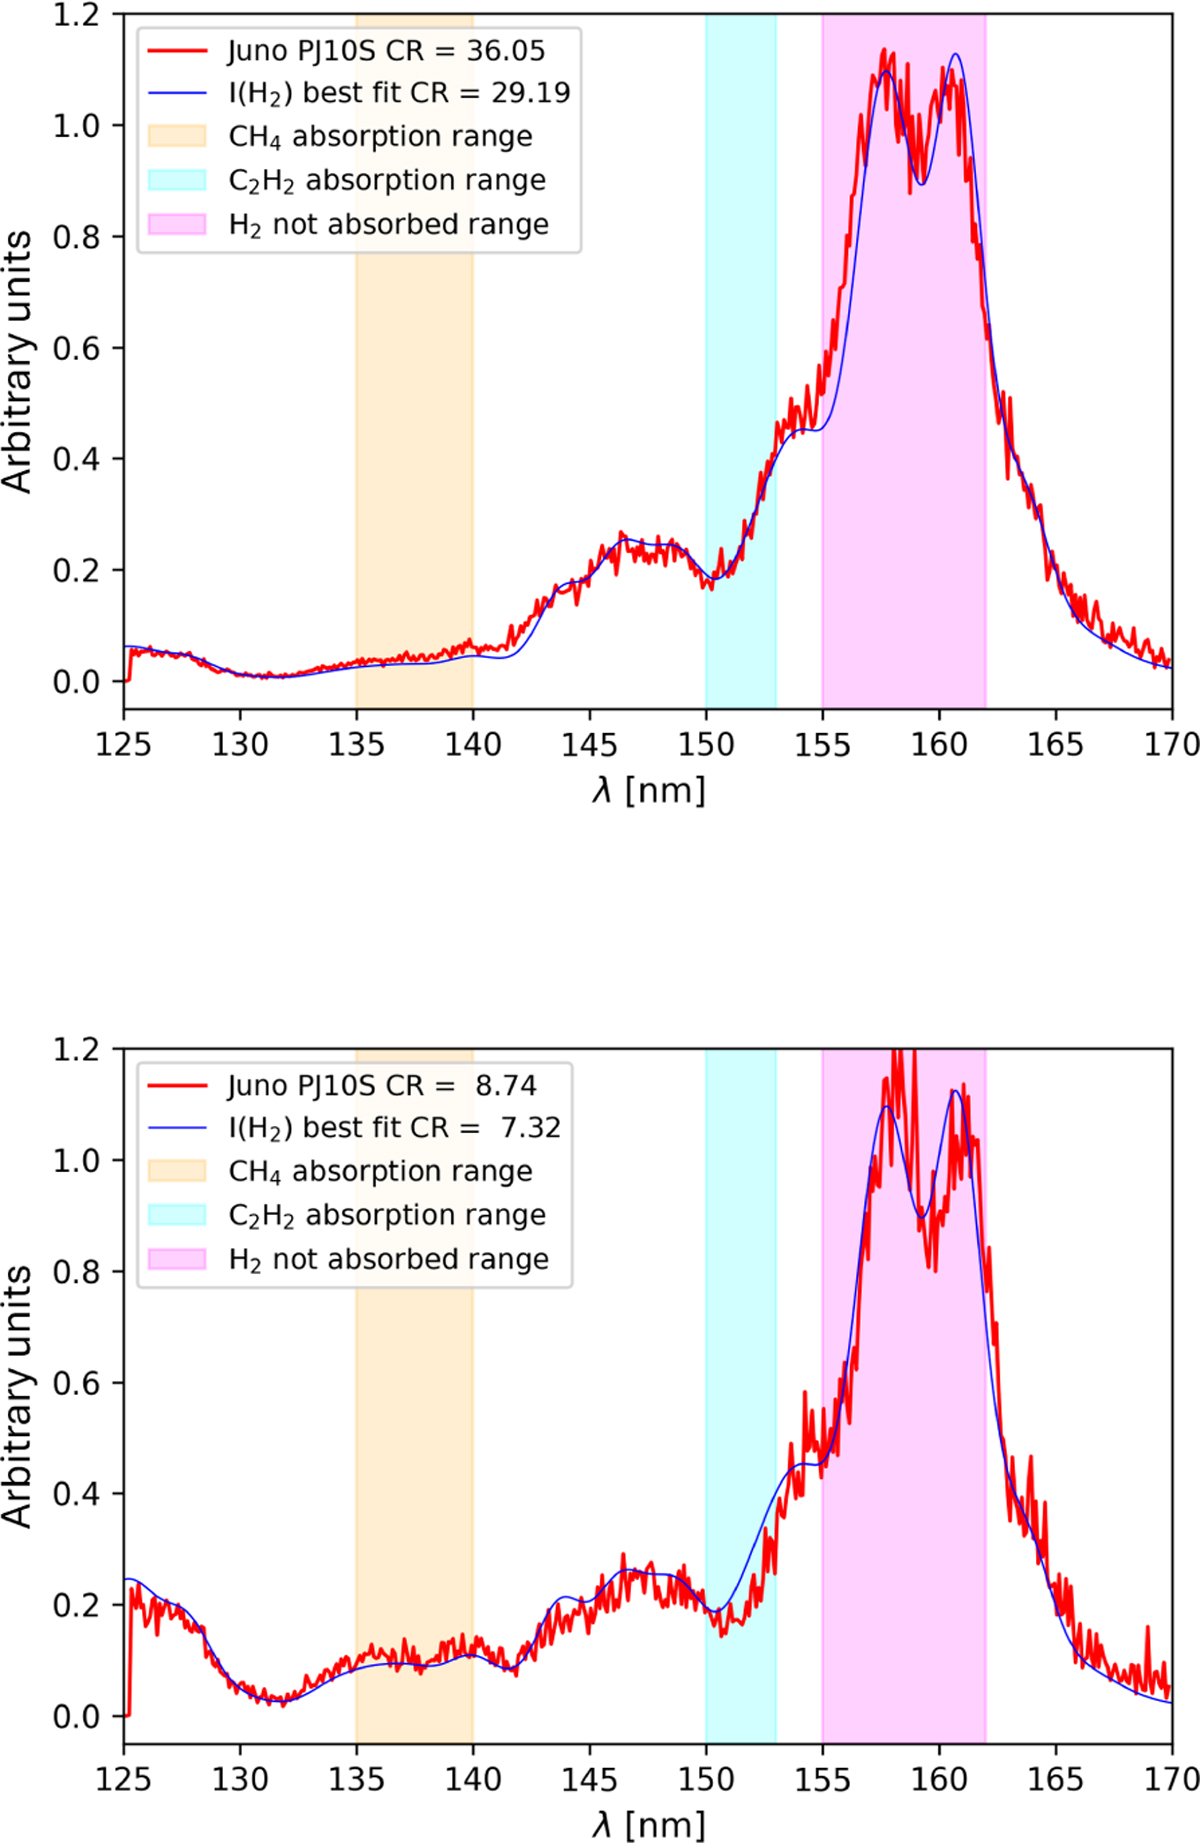
Fig. 9
Download original image
Observed and modeled FUV spectra for two regions in PJ10. Upper panel: observed (red) and modeled (blue) FUV spectra for the region shown in the left panel of Fig. 7. The best fit is obtained with E0 = 54.23 keV and adjustment factors FCH4 = 2.0, FC2H2 = 0.3, FC2H6 = 0.4. This fit requires a CH4 enhancement and C2H2 depletion, suggesting a local atmospheric anomaly. Lower panel: observed (red) and modeled (blue) spectra for the region in the right panel of Fig. 7. The best fit is obtained with E0 = 15 keV and adjustment factors FCH4 = 1.0, FC2H2 = 1.0, and FC2H6 = 1.0. This configuration is consistent with the model atmosphere.
Current usage metrics show cumulative count of Article Views (full-text article views including HTML views, PDF and ePub downloads, according to the available data) and Abstracts Views on Vision4Press platform.
Data correspond to usage on the plateform after 2015. The current usage metrics is available 48-96 hours after online publication and is updated daily on week days.
Initial download of the metrics may take a while.