Fig. 4
Download original image
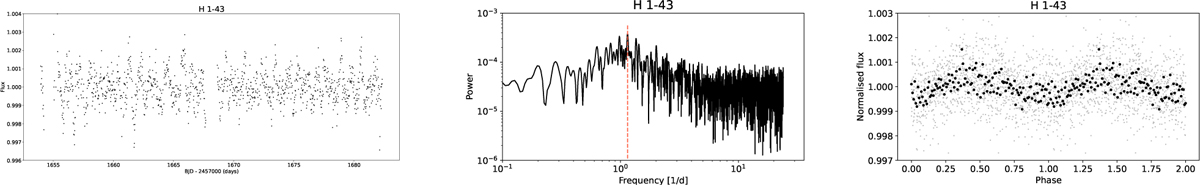
Observed TESS light curve (left panel), frequency power spectrum of the light curve (middle panel), and phase-binning (black) plus phase-folding (gray) light curves of H 1-43 (right panel). The black dots shown in the phase-binning light curve denote the average of the phase-folding curve data points, using the bin = 0.008 in phase.
Current usage metrics show cumulative count of Article Views (full-text article views including HTML views, PDF and ePub downloads, according to the available data) and Abstracts Views on Vision4Press platform.
Data correspond to usage on the plateform after 2015. The current usage metrics is available 48-96 hours after online publication and is updated daily on week days.
Initial download of the metrics may take a while.