Fig. A.1.
Download original image
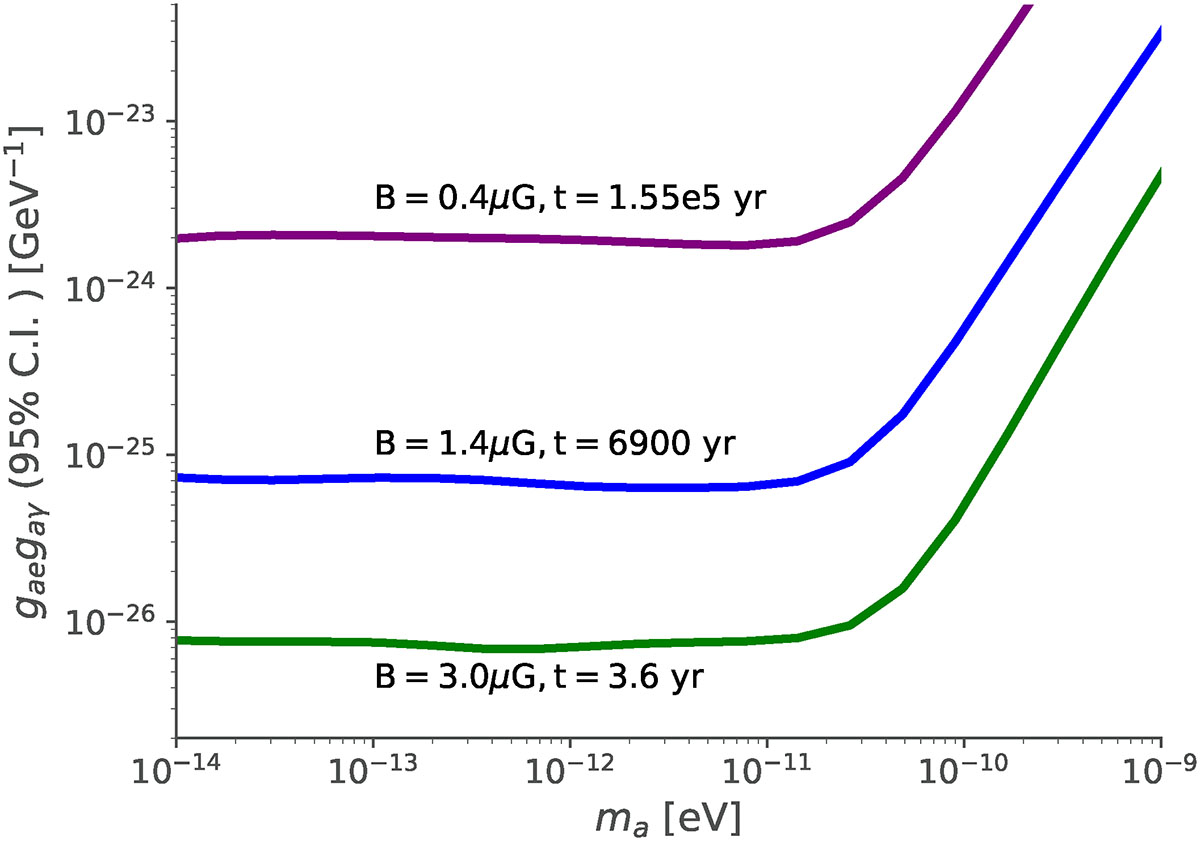
The 95% C.I. upper limits of gae × gaγ as a function of ALP mass ma for the combined analysis of all 18 stars for the energy range 20 − 2000 keV. The solid blue line shows the upper limit for tcc = 6900 yr, assuming a representative value of BT = 1.4 μG. The solid purple line shows the upper limit for the most conservative (BT = 0.4 μG and tcc = 1.55 × 10⁵ yr) and the green line for the most optimistic case (BT = 3.0 μG and tcc = 3.6 yr). Note that the limits for the extended energy range are identical to the ones shown in Fig. 8 as the ALP spectrum peaks around 500 keV or below.
Current usage metrics show cumulative count of Article Views (full-text article views including HTML views, PDF and ePub downloads, according to the available data) and Abstracts Views on Vision4Press platform.
Data correspond to usage on the plateform after 2015. The current usage metrics is available 48-96 hours after online publication and is updated daily on week days.
Initial download of the metrics may take a while.