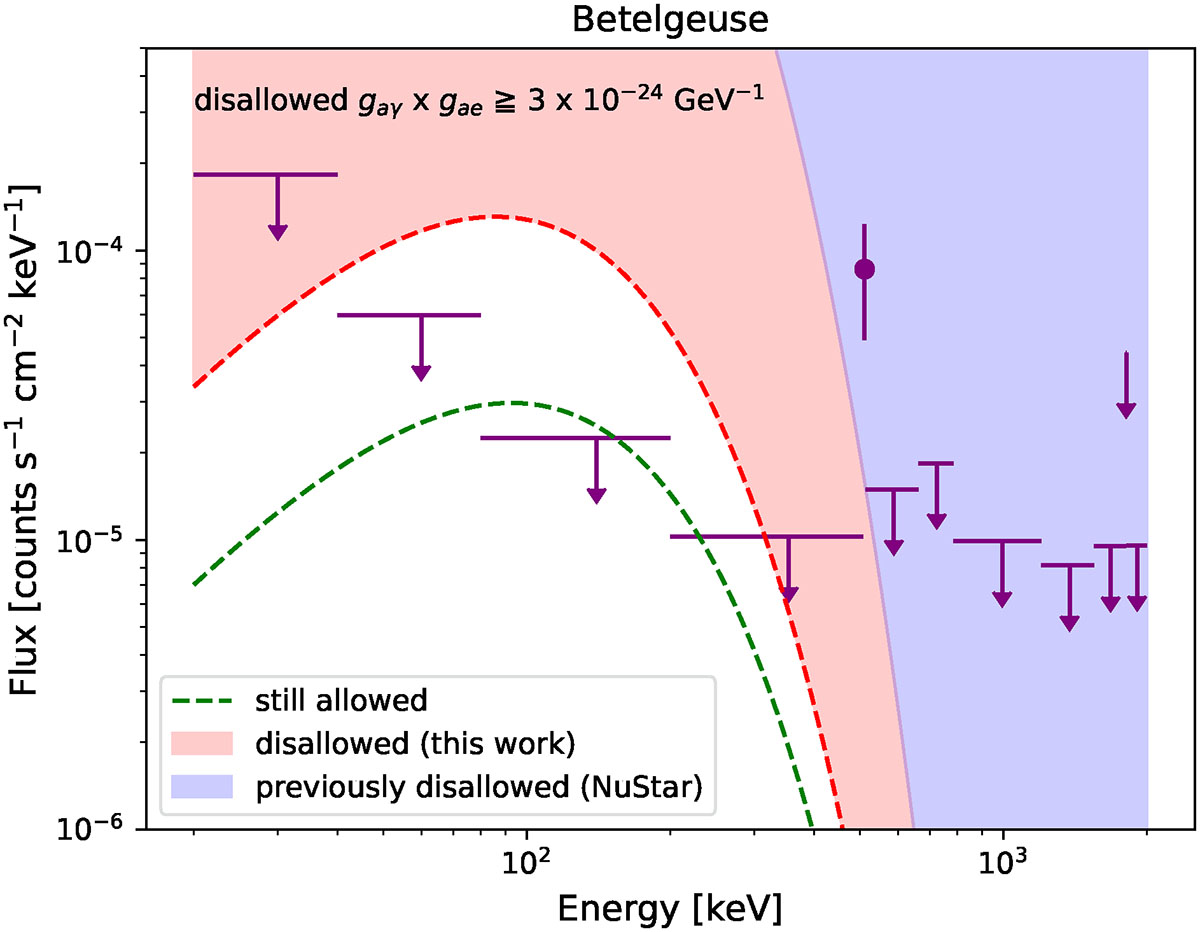
Fig. 4.
Download original image
Betelgeuse spectrum as obtained from SPI for the 20–2000 keV energy range. The dot with the error bar shows the flux value in that energy bin. The downward-pointing arrows show the 3σ upper limit for bins where the flux significance is less than 2σ. The 511 keV bin is systematically large because of incomplete modeling of the diffuse emission in the Crab/Orion region and is therefore not taken as a detection of 511 keV in Betelgeuse. The red shaded region shows the flux from the gaγ × gae values allowed by NuSTAR that can now directly be excluded from the ALP parameter space since the flux prediction from them is larger than the 3σ flux limits from SPI. The excluded limit is gaγ × gae ≧ 3 × 10⁻²⁴ GeV−1. The blue shaded region shows the flux from the gaγ × gae values that were already disallowed in the NuSTAR study (Xiao et al. 2022).
Current usage metrics show cumulative count of Article Views (full-text article views including HTML views, PDF and ePub downloads, according to the available data) and Abstracts Views on Vision4Press platform.
Data correspond to usage on the plateform after 2015. The current usage metrics is available 48-96 hours after online publication and is updated daily on week days.
Initial download of the metrics may take a while.