Fig. 6.
Download original image
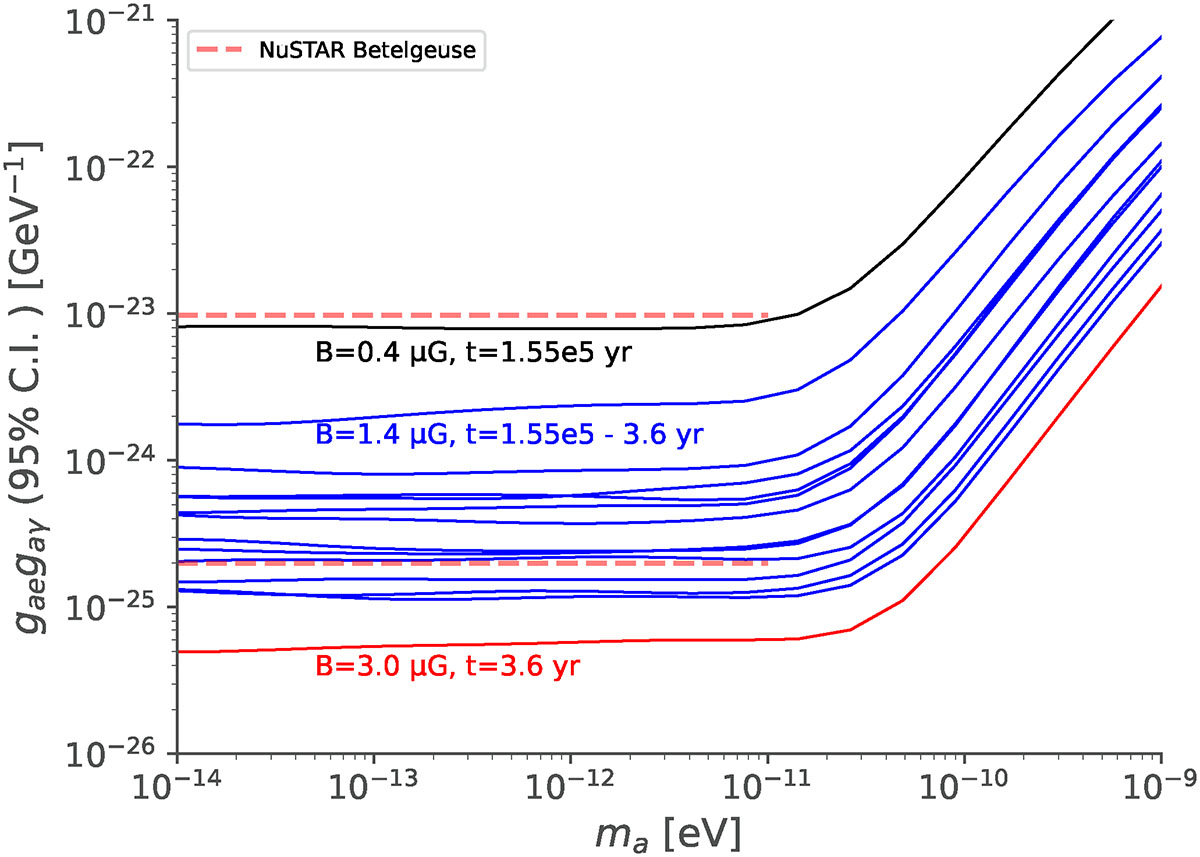
95% C.I. upper limits of gae × gaγ as function of ALP mass for Betelgeuse in the 20 − 600 keV energy range. The solid blue lines show the upper limit for each stellar model, assuming a representative value of BT = 1.4 μG with the top blue line corresponding to tcc = 1.55 × 10⁵ yr and the bottom blue line corresponding to tcc = 3.6 yr. The constraints will scale with different BT as in Eq. (4); the solid black line shows the upper limit for the most conservative (BT = 0.4 μG and tcc = 1.55 × 10⁵ yr) and the solid red line for the most optimistic cases (BT = 3.0 μG and tcc = 3.6 yr). For comparison, we also show the 95% C.I. upper limits of gae × gaγ obtained from Xiao et al. (2022) for the most conservative and optimistic cases with dashed red lines.
Current usage metrics show cumulative count of Article Views (full-text article views including HTML views, PDF and ePub downloads, according to the available data) and Abstracts Views on Vision4Press platform.
Data correspond to usage on the plateform after 2015. The current usage metrics is available 48-96 hours after online publication and is updated daily on week days.
Initial download of the metrics may take a while.