Open Access
Fig. 7.
Download original image
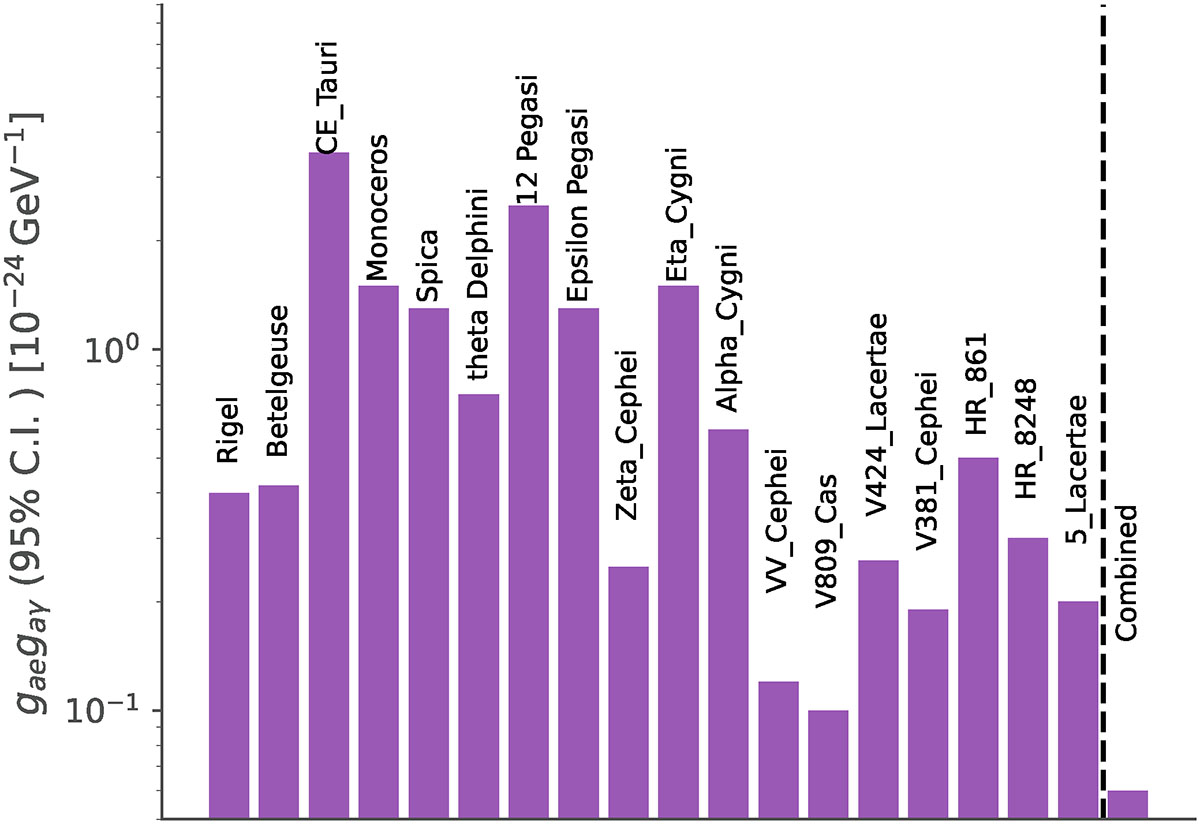
95% C.I. upper limits of gae × gaγ for the entire star sample (individual stars, and from a combined analysis) for BT = 1.4 μG and tcc = 6900 yr and ma < 10−11 eV.
Current usage metrics show cumulative count of Article Views (full-text article views including HTML views, PDF and ePub downloads, according to the available data) and Abstracts Views on Vision4Press platform.
Data correspond to usage on the plateform after 2015. The current usage metrics is available 48-96 hours after online publication and is updated daily on week days.
Initial download of the metrics may take a while.