Fig. 13.
Download original image
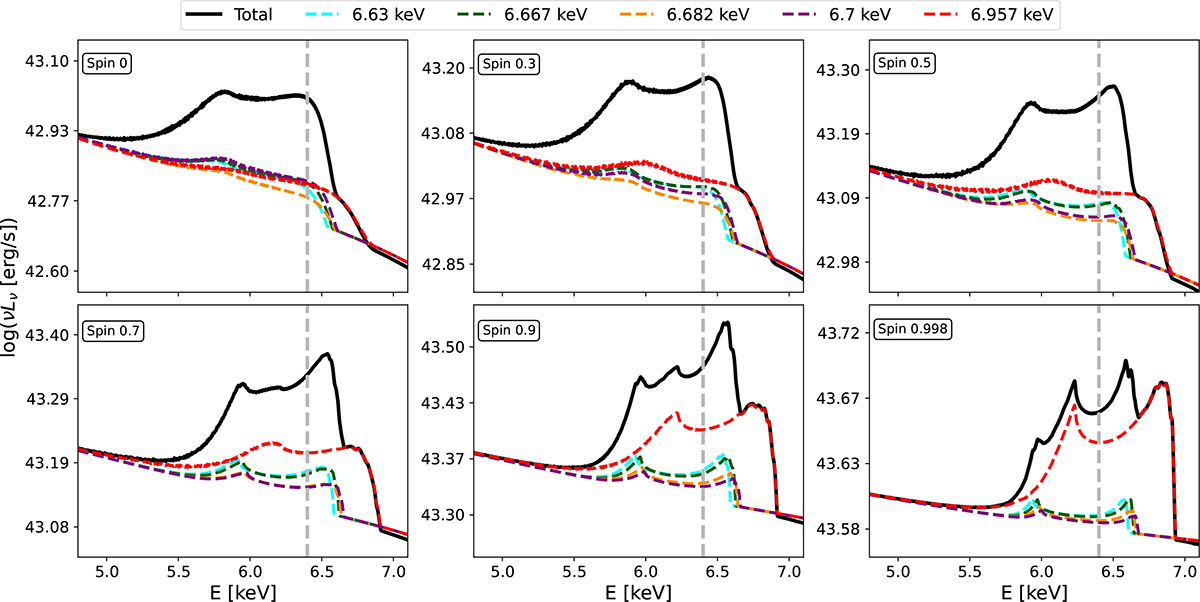
Contribution of major Fe Kα lines to the total observed line profile is plotted by the solid black line. Lines emitted locally at 6.63 keV (cyan), 6.667 keV (green), 6.682 keV (orange), and 6.7 keV (brown) are contributions from the different ionization states of FeXXV, while the line at 6.957 keV (red) is the contribution from the FeXXVI ion. The continuum level is arbitrarily lumped together for better visualization. Different panels are for various spin values marked in the boxes, all for θobs = 15°. The vertical dashed line marks the position of 6.4 keV energy.
Current usage metrics show cumulative count of Article Views (full-text article views including HTML views, PDF and ePub downloads, according to the available data) and Abstracts Views on Vision4Press platform.
Data correspond to usage on the plateform after 2015. The current usage metrics is available 48-96 hours after online publication and is updated daily on week days.
Initial download of the metrics may take a while.