Fig. 2.
Download original image
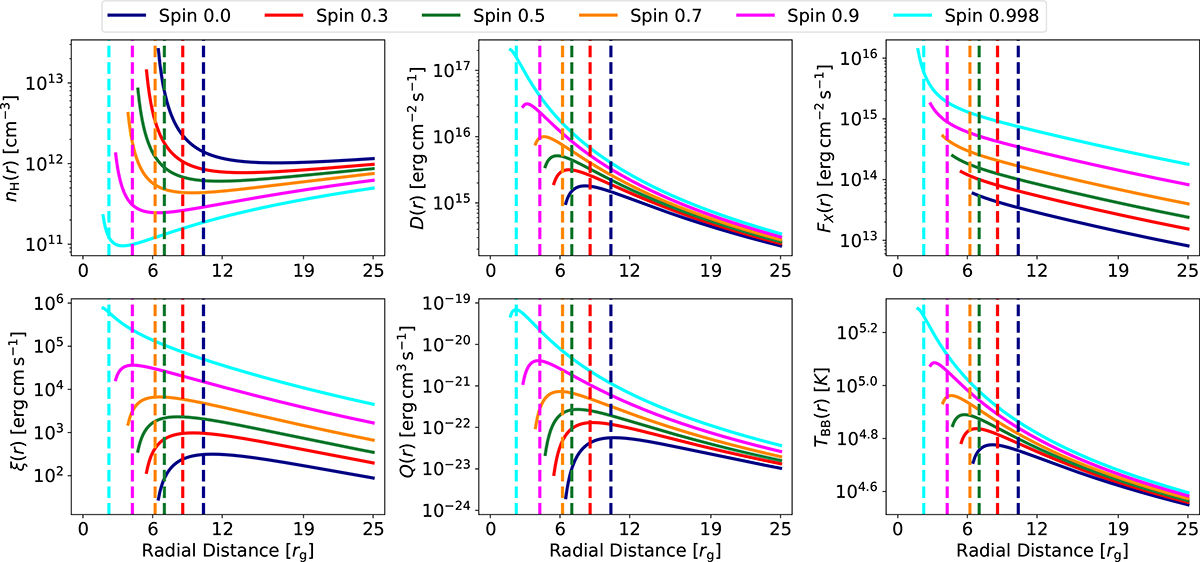
Radial distribution of global model parameters that are inputs for TITAN code. The colors represent different spin values given in the top box. The subplots are as follows: top left panel: gas number density (Eq. (1)), top middle panel: dissipation flux (Eq. (2)), top right panel: X-ray flux from a hot corona (Eq. (5)), bottom left panel: ionization parameter (Eq. (9)), bottom middle panel: internal heating of the warm corona (Eq. (10)), and bottom right: accretion disk temperature TBB (Eq. (11)). The vertical dashed lines mark the radius at which the output temperature structure from TITAN reaches the maximum, see Fig. 3 and text for details.
Current usage metrics show cumulative count of Article Views (full-text article views including HTML views, PDF and ePub downloads, according to the available data) and Abstracts Views on Vision4Press platform.
Data correspond to usage on the plateform after 2015. The current usage metrics is available 48-96 hours after online publication and is updated daily on week days.
Initial download of the metrics may take a while.