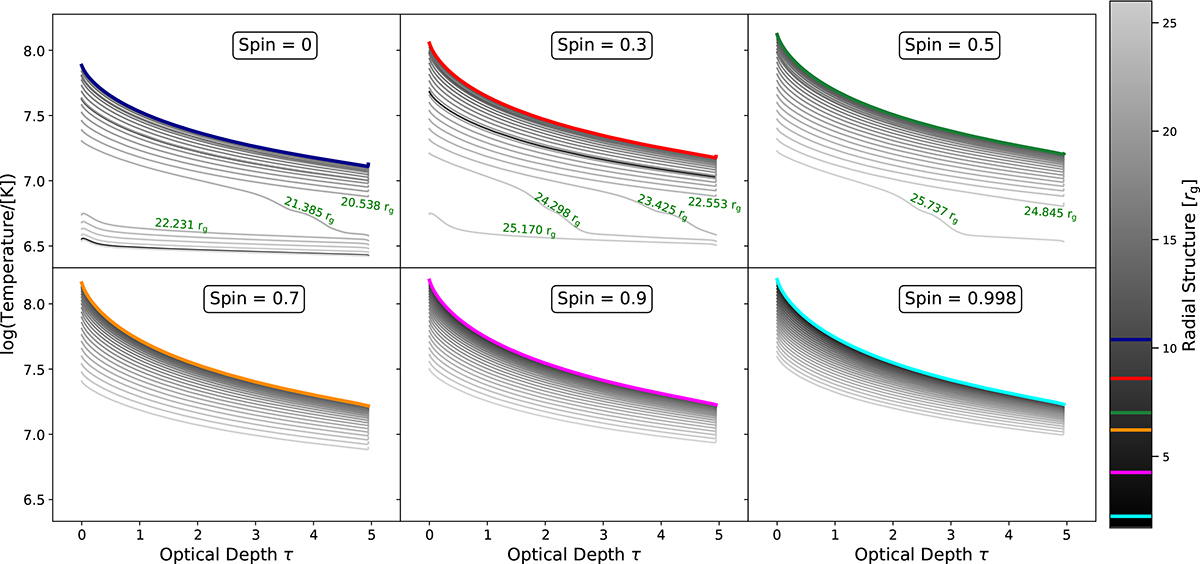
Fig. 3.
Download original image
Temperature dependence on the optical depth for various spin values given in the boxes. The gray gradient of lines represents the matter structure calculated at different radii, with the darkest line at rin, and the lightest line at rout. The colored lines show the simulation with maximum temperature, which is consistent with the dashed line in Fig. 2. The corresponding radial point where the temperature drop is observed is labeled and marked in green text. The parameters other than spin are chosen to be canonical values from Table 2. As this is the temperature structure, it is independent of the viewing angle.
Current usage metrics show cumulative count of Article Views (full-text article views including HTML views, PDF and ePub downloads, according to the available data) and Abstracts Views on Vision4Press platform.
Data correspond to usage on the plateform after 2015. The current usage metrics is available 48-96 hours after online publication and is updated daily on week days.
Initial download of the metrics may take a while.